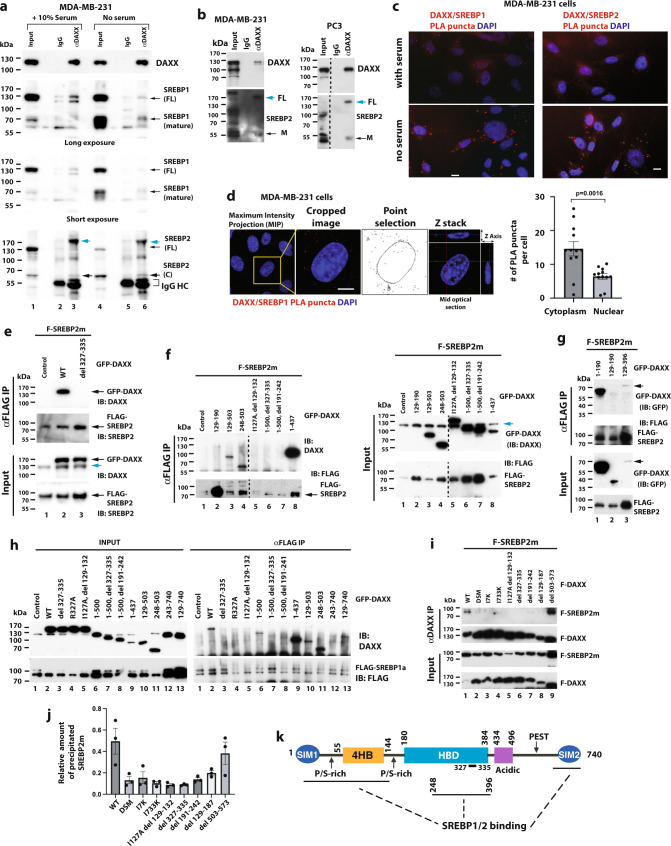
Fig. 2. DAXX binds to SREBP1 and SREBP2 and the DAXX SIMs are important for DAXX-SREBP2 interaction.
a, b The endogenous DAXX and SREBP1/2 interact. Total cell extracts of the indicated cell lines were subjected to IP. FL full-length (precursor), M mature, C cleaved C-terminal fragment. c Representative images of Proximity Ligation Assay (PLA) showing the interactions of DAXX with SREBP1 and SREBP2. d Quantification of nuclear and cytoplasmic DAXX–SREBP1 PLA puncta using confocal microscopy. Data are presented as mean values ± SEM (n = 12), and the P value was calculated based on unpaired two-tailed t test. e–g The binding sites in DAXX for mature SREBP2. The cell lysates of transfected 293T cells were subjected to anti-FLAG IP. The DAXX constructs were detected with an anti-DAXX antibody in (e, f) or an anti-GFP antibody in (g). The endogenous DAXX in the input samples is denoted with a cyan arrow in (e, f). The arrow points to the GFP-DAXX 129–396 band in (g). HC IgG heavy chain. h Cotransfection of FLAG-SREBP1a (mature) and the indicated GFP-DAXX constructs, IP and immunoblotting were performed as in (e–g). i Both DAXX SIM1 and SIM2 are important for binding to mature SREBP2. The indicated FLAG-tagged DAXX (F-DAXX) and mature SREBP2 (F-SREBP2m) were expressed in 293T cells by transient transfections and subjected to IP with an anti-DAXX antibody. j Quantification of SREBP2m co-immunoprecipitated with DAXX. Data are presented as mean values ± SEM (n = 3). The band intensities of immunoprecipitated F-SREBP2m and F-DAXX were quantified using the ImageJ software. The band intensities of F-SREBP2m were normalized to the co-precipitated F-DAXX. k Schematic drawing of DAXX-SREBP2 interactions. The position of amino acid (aa) 327–335 within the DAXX HBD critical for the DAXX–SREBP interactions is indicated. SIM SUMO-interacting motif, 4HB DAXX helical bundle, HBD histone-binding domain, P/S proline/serine, PEST proline, glutamic acid, serine, and threonine-rich sequence. Numbers refer to aa positions of DAXX. Microscopic scale bar: 10 µm. Source data are provided as a Source Data file.

