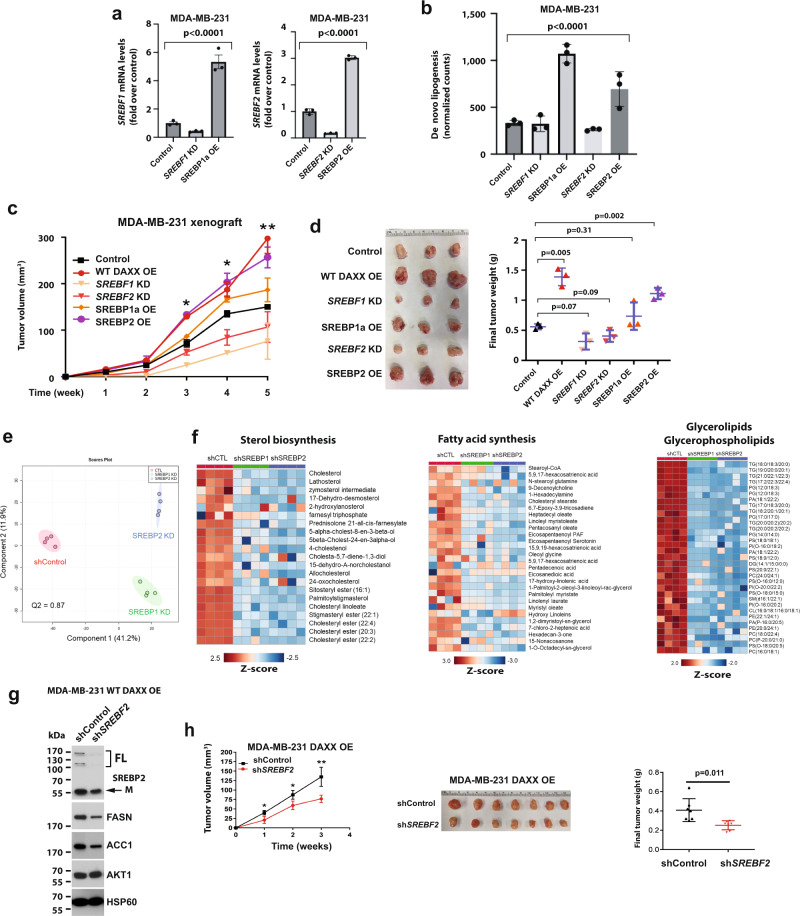
Fig. 6. SREBP1, SREBP2, and the DAXX–SREBP axis promote lipid synthesis and tumor growth.
a Cells derived from MDA-MB-231 cell line with a vector for a control, an SREBF1 shRNA (KD), or SREBP1a (mature) cDNA, an SREBF2 shRNA (KD), or SREBP2 (mature) cDNA were subjected to RT-qPCR for assessing the expression of SREBF1 and SREBF2. b The panel of cell lines in (a) were tested for de novo lipogenesis assays using [1-14C] acetate. In (a, b), the P values were calculated using ordinary one-way ANOVA (n = 3 biologically independent samples). c, d The panel of MDA-MB-231-derived cell line shown in (a) were xenografted into mammary fat pads of female NSG mice (n = 3 tumor-bearing mice). Tumor volumes were plotted against time (c). The images of dissected tumors are shown, and the final tumor weights are plotted (d). e PCA of lipidomes in shControl (shCTL), shSREBP1 and shSREBP2 cells. Each dot represents a sample (n = 4). f Heatmap analysis of selected lipid molecules in the sterol, fatty acid and glycerolipid/glycerophospholipid class of lipids in SREBP1 KD or SREBP2 KD cells compared to control cells. g Control or SREBP2 shRNA were expressed in MDA-MB-231 cells with DAXX OE. The levels of the indicated proteins were assessed by immunoblot. h The indicated cells shown in (g) were xenografted into mammary fat pads of female NSG mice. Tumor volumes were plotted against time. Representative images of dissected tumors are shown. The final tumor weights are plotted (n = 7 tumor-bearing mice). All data are presented as mean values ± SEM. The P values in (c, d, h) were calculated based on unpaired two-tailed t test. *P < 0.05; **P < 0.01. Source data are provided as a Source Data file.

