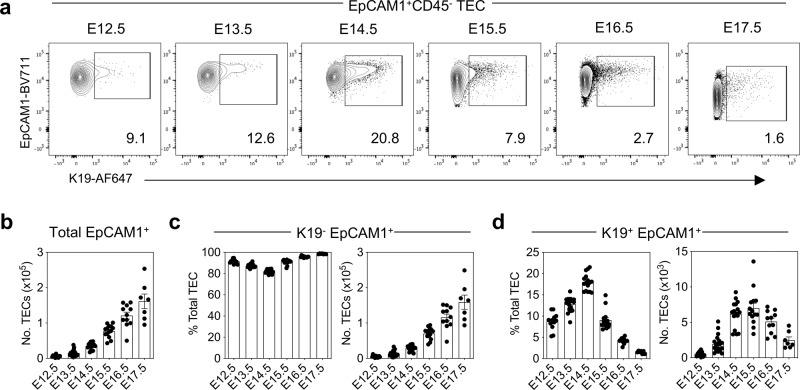
Fig. 1. K19 is expressed by a subset of embryonic TEC.
a Representative FACS plots showing expression of K19 by EpCAM1+ cells during ontogeny. b Numbers of total EpCAM1+ cells. c Numbers and proportions of K19- EpCAM1+ cells. d Numbers and proportion of K19+ EpCAM1+ cells (E12.5 n = 12, E13.5 n = 20, E14.5 n = 16, E15.5 n = 15, E16.5 n = 11, E17.5 n = 7, from three independent experiments per gestational age). The data are shown as mean ± SEM.

