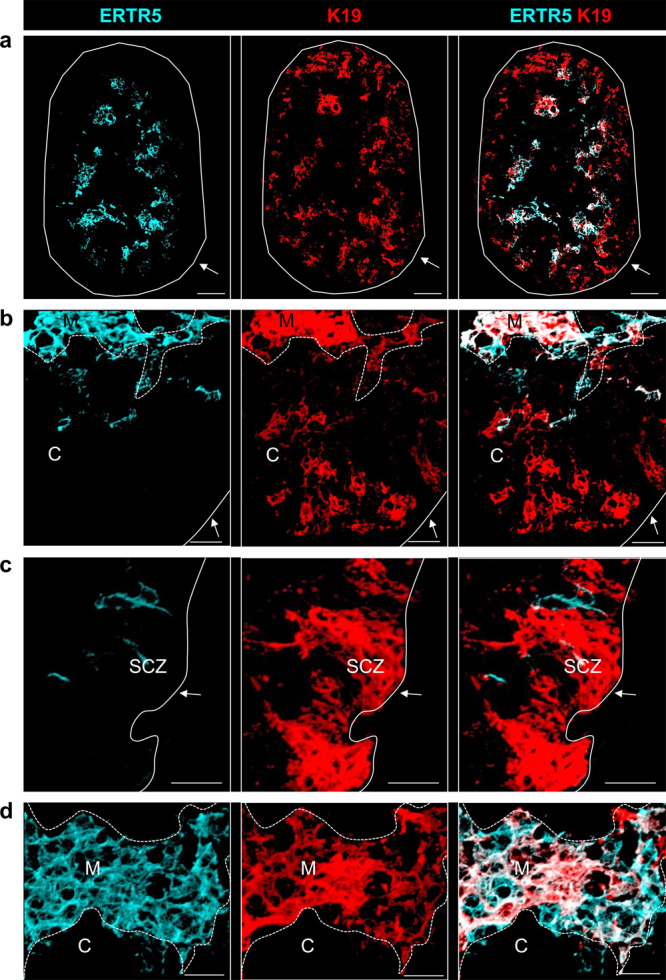
Fig. 2. K19+ TEC are widely distributed within thymic microenvironments.

a Immunofluorescence of an E15.5 thymus lobe stained for ERTR5 (turquoise) and K19 (red), Scale bar, 50 µm. b K19 expression within ERTR5- cortical regions. Scale bar, 20 µm. c K19 expression within the subcapsular zone. d K19 expression within ERTR5+ medullary areas. Scale bars in b–d, 20 m. SCZ subcapsular zone, C cortex, M medulla. Solid white lines indicate the edge of the thymus; dashed white lines indicate the boundary between cortex and medulla. Images are representative of 6 thymi, from 3 independent experiments.
