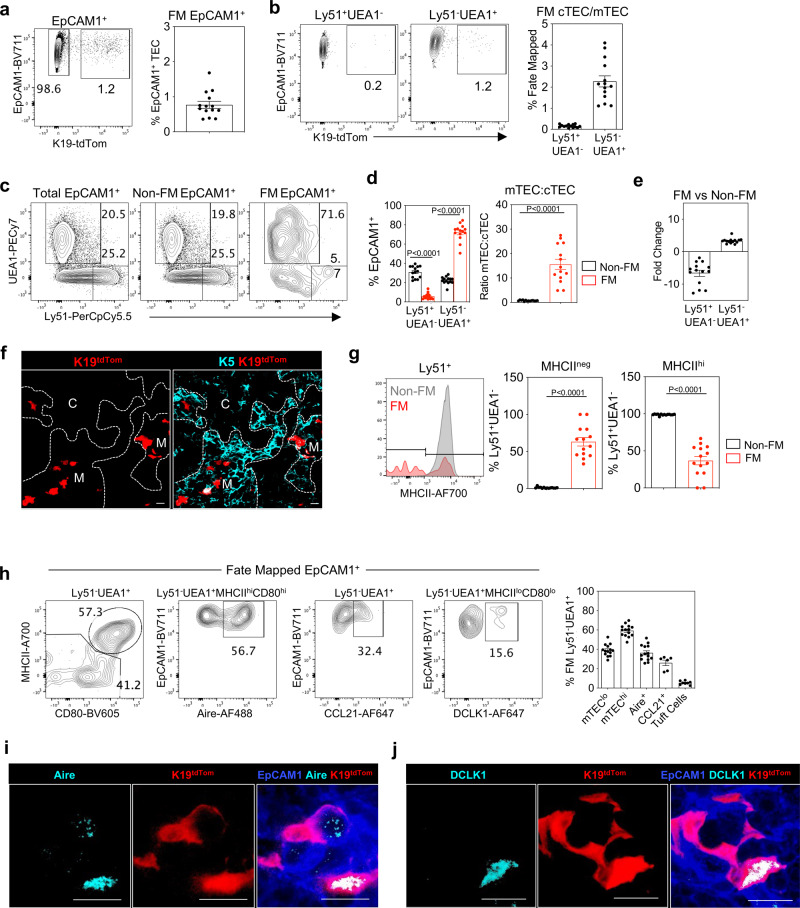
Fig. 4. K19 identifies embryonic multipotent mTEC progenitors (mmTECp).
a K19Cre was induced in Krt19CreERTtdTom embryos at E15.5 via the administration of tamoxifen to pregnant mice, and fate-mapped thymi were harvested at PNd0 (n = 14, from 3 independent experiments). Fate-mapped cells were detected within EpCAM1+ cells by flow cytometry and quantitated. b Representative FACS plots and quantitation of K19-tdTom fate-mapped cells within EpCAM1+UEA1+ and EpCAM1+Ly51+ TEC. c Expression of Ly51 and UEA1 by total EpCAM1+ cells, K19-tdTom- EpCAM1+ cells (non-fate-mapped) and K19-tdTom+EpCAM1+ cells (fate-mapped). d Bar charts show proportions of Ly51+UEA1- and Ly51-UEA1+ cells, and mTEC:cTEC ratio within non-fate-mapped and fate-mapped TEC. e Bar chart shows fold change in Ly51+UEA1- and Ly51-UEA1+ cells within non-fate-mapped and fate-mapped TEC. f Immunofluorescence of PNd0 thymi following K19-fate-mapping at E15.5. K19-tdTom (red) and K5 (turquoise). ‘C’, and ‘M’ indicate cortex and medullary areas respectively. Scale bar denotes 20 μm. Image representative of 4 thymi. g Expression of MHCII by EpCAM1+Ly51+ fate-mapped (FM) or non-fate-mapped (Non-FM) TEC. h Representative FACS plots illustrating the phenotype of fate-mapped mTEC subsets. mTEChi (MHCIIhiCD80hi, n = 14), mTEClo (MHCIIloCD80lo, n = 14), Aire+ (MHCIIhiCD80hiAire+, n = 14), CCL21+ (n = 6), tuft cells (MHCIIloCD80loDCLK1+, n = 8), and corresponding quantitation. i, j Immunofluorescence of PNd0 thymi where K19Cre was induced at E15.5. Scale bar denotes 10 μm. Image representative of 4 thymi, from 3 independent experiments. K19-tdTom (red), EpCAM1 (blue), f Aire (turquoise), g DCLK1 (turquoise). Data analysed using a Student’s t test. The data are shown as mean ± SEM.

