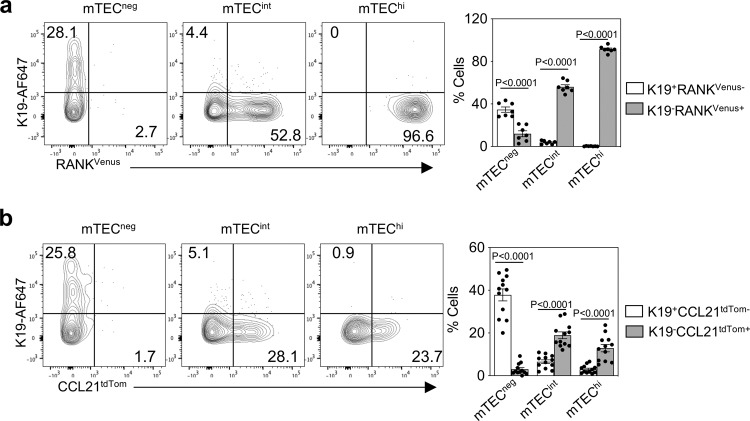
Fig. 6. K19+ TEC appear prior to RANK and CCL21 stages of mTEC development.
a Representative FACS plots showing expression of K19 and RANKVenus by mTECneg (MHCII-CD80-), mTECint (MHCIIintCD80int) and mTEChi (MHCIIhiCD80hi) at E15.5, and corresponding quantitation, n = 7, from 3 independent experiments. b Representative FACS plots showing expression of K19 and CCL21tdTom by mTECneg (MHCII-CD80-), mTECint (MHCIIintCD80int) and mTEChi (MHCIIhiCD80hi) at E15.5, and corresponding quantitation, n = 12, from 3 independent experiments. Data analysed using a Student’s t test. The data are shown as mean ± SEM.

