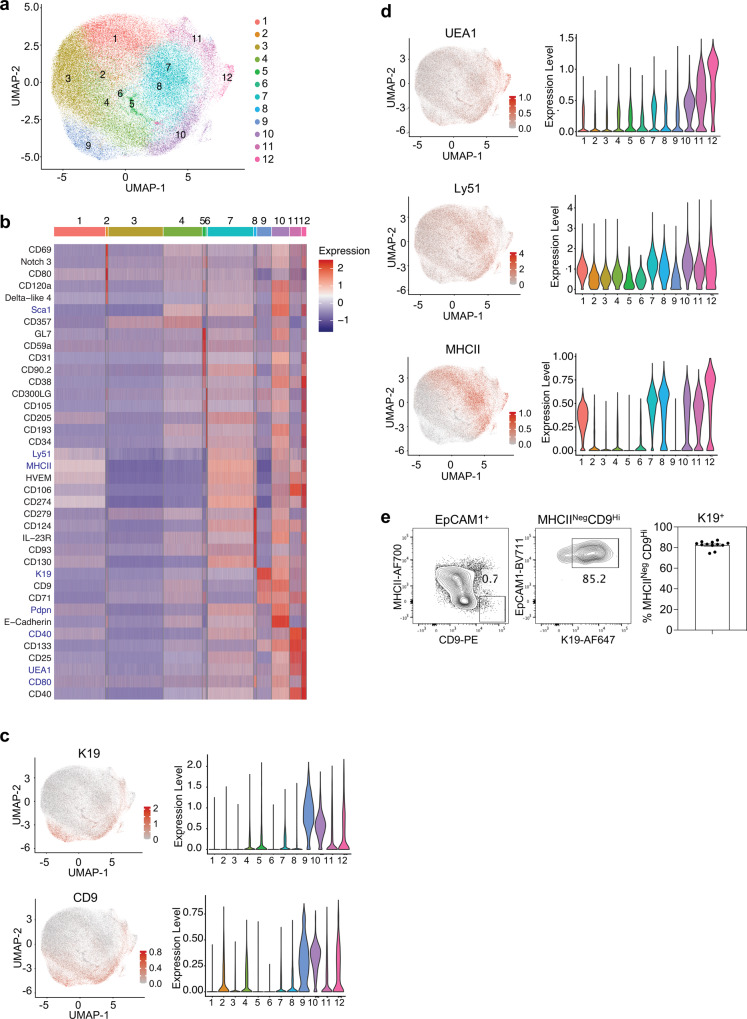
Fig. 9. CD9 expression defines mmTECp in wild-type mice.
a–c Infinity Flow analysis was used to impute the expression of surface markers on TEC (CD45-EpCAM1+) derived from thymi of E15.5 WT embryos. a Hierarchical clustering analysis was performed on 121832 TEC and projected in a two-dimensional space using UMAP. Each colour represents a specific cluster as indicated. b Heatmap displays the expression of the top 5 markers upregulated in each cluster (log fold-change >0.15). Backbone markers have a blue font. c UMAP graphs and violin plots illustrating the expression of K19 and CD9. d UMAP graphs and violin plots illustrating the expression of UEA1, Ly51 and MHCII. Colour gradient indicates expression levels in the UMAP graphs and colours in the violin plots represent the different clusters, as defined in a. e Representative FACS plots showing expression of K19 by MHCIIloCD9hi TEC and corresponding quantitation, n = 12, from 3 independent experiments. The data are shown as mean ± SEM.

