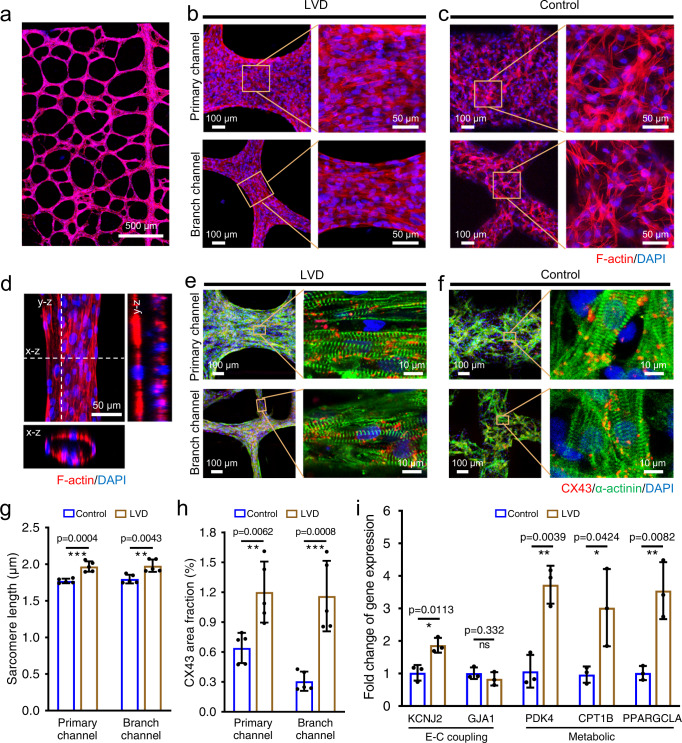
Fig. 3. Structural characterization and maturation of the engineered LVD-rat-cardiac tissues.
F-actin staining of 5-day-old LVD-cardiac tissue (a), and the representative images in different locations of LVD (b) and control tissues (c). d Confocal images of LVD-cardiac bundles showing the tubular structures. Representative images of rat-CM proteins expression stained for sarcomeric α-actinin (green), CX43 (red), and DAPI (blue) in LVD (e) and control (f) tissues after 5 days of culture. Quantitative analysis of sarcomeric length (g) and CX43 area fraction (h). n = 5 independent samples. i Relative gene expression in LVD tissues vs. control tissues. n = 3 independent samples. Data are represented as mean values ± standard deviation. The significant difference is determined by unpaired two-tailed t-test, 95% confidence interval. *p < 0.05, **p < 0.01, ***p < 0.001 and ns (p > 0.05) no significant difference.

