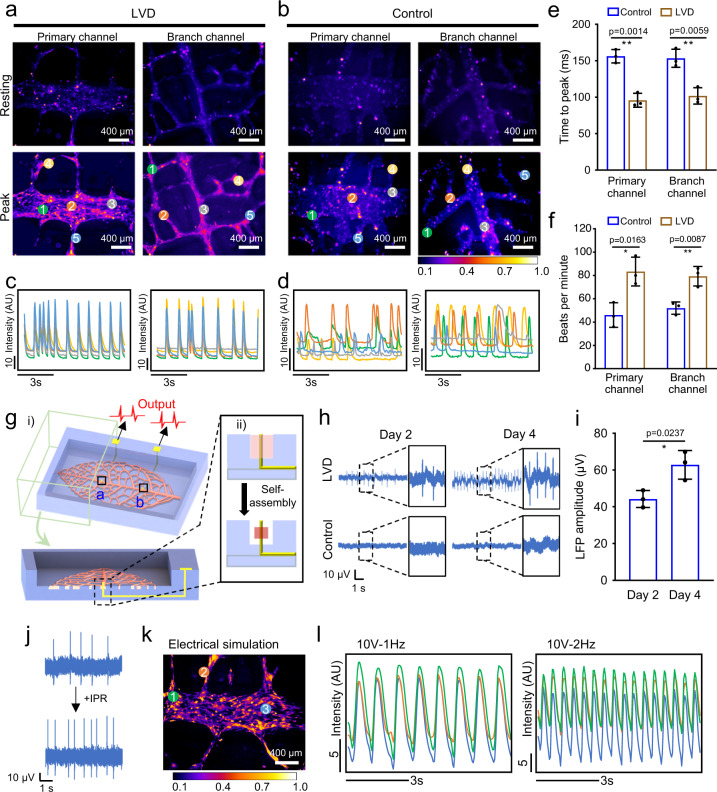
Fig. 4. Electrophysiological functions of the engineered LVD-rat-cardiac tissues.
Fluorescence micrographs of calcium transients showing the regions of interest in LVD (a) and control (b) tissues. Quantification of calcium transients in LVD (c) and control (d) after 5 days of culture (separate regions of interest are represented in different colors). AU indicates arbitrary units. e The quantification of time to peak of calcium transient correspondingly. n = 3 independent samples. f The quantification of beating rate in spontaneously beating LVD and control tissues. n = 3 independent samples. g Schematic of customized in situ electrical recording/stimulation system. h Representative field potentials recorded from the 2-day-old LVD tissue by the two integrated microelectrodes with the distance gap of 10 mm. i Electrophysiological data collected in the LVD (top row) and control (bottom row) tissues. n = 3 independent samples. j Local field potential change before and after the addition of isoproterenol (5 μM). k Fluorescence micrograph of calcium transients showing the regions of interest in LVD tissue under electrical stimulation. l Quantification of calcium transients (as quantified through normalized fluorescence intensity) with a 10 V, 50 ms, 1 Hz, and 2 Hz pacing regime (separate regions of interest are represented in different colors). Data are represented as mean values ± standard deviation. The significant difference is determined by unpaired two-tailed t-test, 95% confidence interval. *p < 0.05, **p < 0.01.

