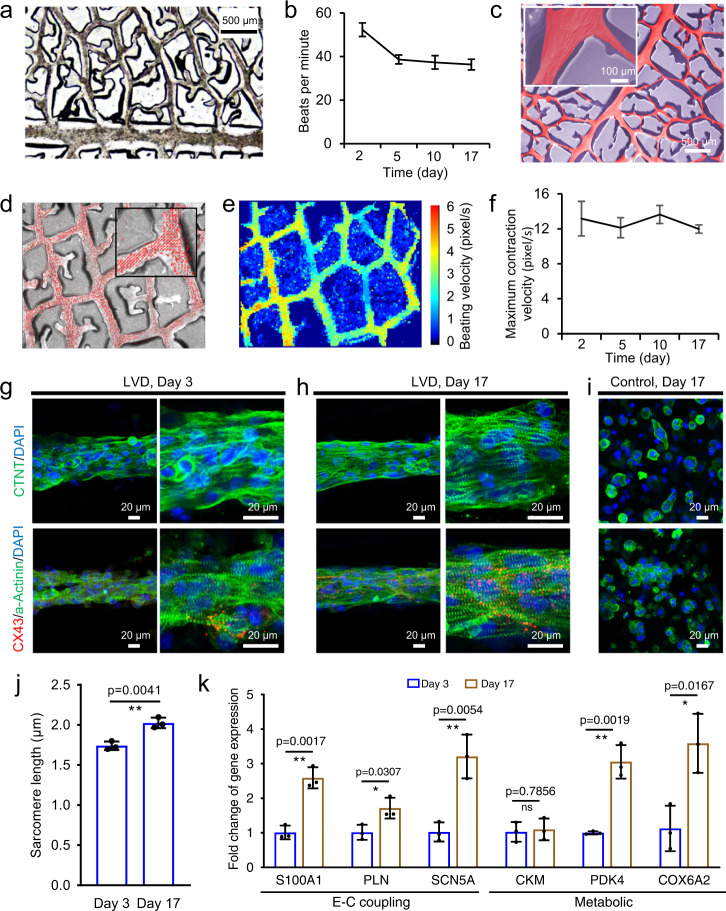
Fig. 5. Characterization of the engineered LVD-human-cardiac tissues from hiPSC-CMs.
a Bright-field image of LVD tissue in microchannels after 2 days of culture. b Quantification of beating rate of LVD tissue at different time points. n = 3 independent samples. c SEM image of LVD tissue in microchannel after 17 days of culture. Inset: a higher-magnification image of LVD bundle. d–f Contractile motion tracking of beating LVD tissues in microchannels. d Representative frame overlayed with the respective motion vectors. Inset: higher-magnification image showing the motion vectors of LVD tissue. e Heat map of localized mean contraction velocities. f Maximum contraction velocities of beating LVD tissues at different time points. n = 3 independent samples. Sarcomeric structures/CX43 and CTNT staining of cellular bundles (left row) and their higher-magnification view (right row) in LVD tissues after 3 days (g) and 17 days (h) of culture, compared with that in control tissues after 17 days (i) of culture. j Quantitative analysis of sarcomeric length in LVD tissues. n = 3 independent samples. k Relative gene expression in 3-day-old vs. 17-day-old LVD-human cardiac tissues. Data are represented as mean values ± standard deviation. The significant difference is determined by unpaired two-tailed t-test, 95% confidence interval. *p < 0.05, **p < 0.01, and ns (p > 0.05) no significant difference.

