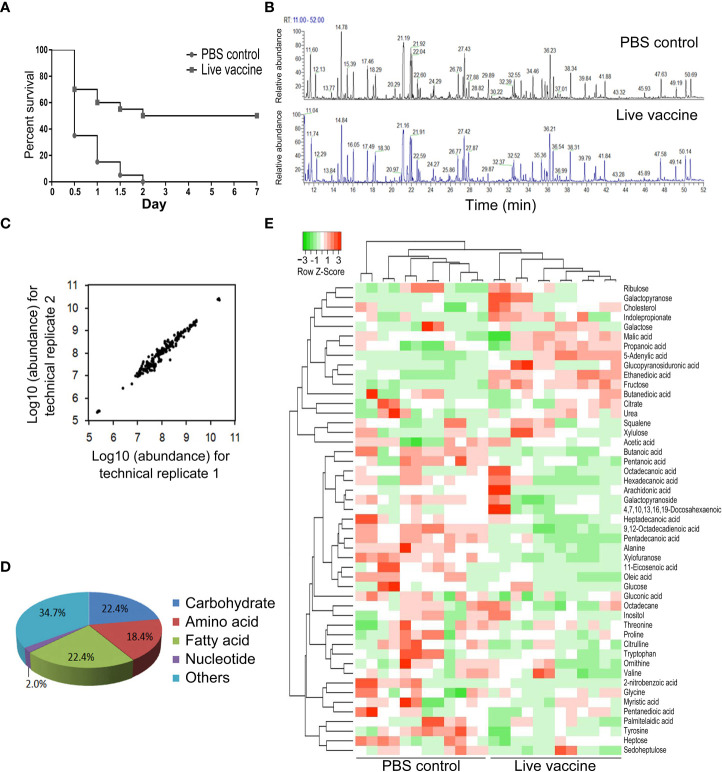
Figure 1.
Metabolomic profiling of identified metabolites. (A) Survival of mice immunized by live E. tarda vaccine and then challenged by EIB202. (B) Representative total ion current chromatogram from control and live groups. (C) Reproducibility of metabolomic profiling platform. The correlation coeffcient is shown by two technical replicates of metabolite abundances. (D) Category of the identified metabolites. (E) Cluster analysis of metabolites. Heat map shows differential metabolites. Green and red color indicates decrease and increase of metabolites, respectively (see color scale).

