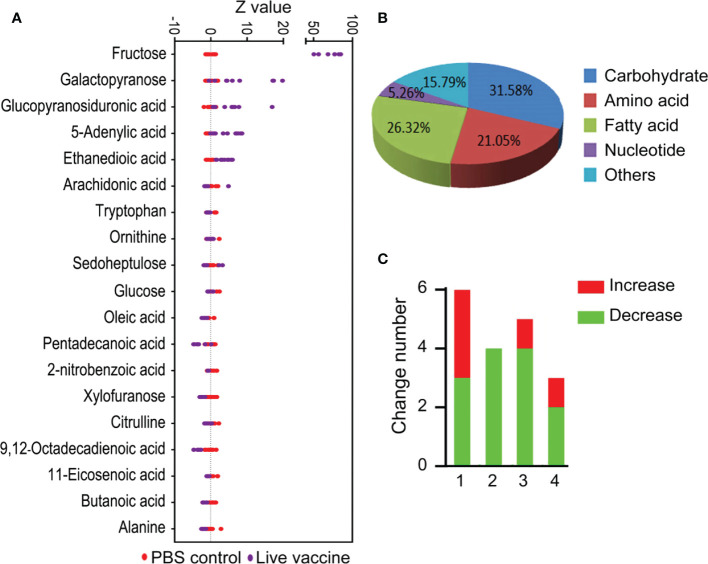
Figure 2.
Differential metabolites analysis in response to vaccine stimulation. (A) Z-score plot of differential metabolites immunized with vaccine compared with PBS control. Each point represents one metabolite in one technical repeat and colored by sample types. (B) Category of different metabolites in live bacteria group. (C) Number of differential metabolites in live bacteria group. 1, carbohydrate; 2, amino acid; 3, fatty acid; 4, others.

