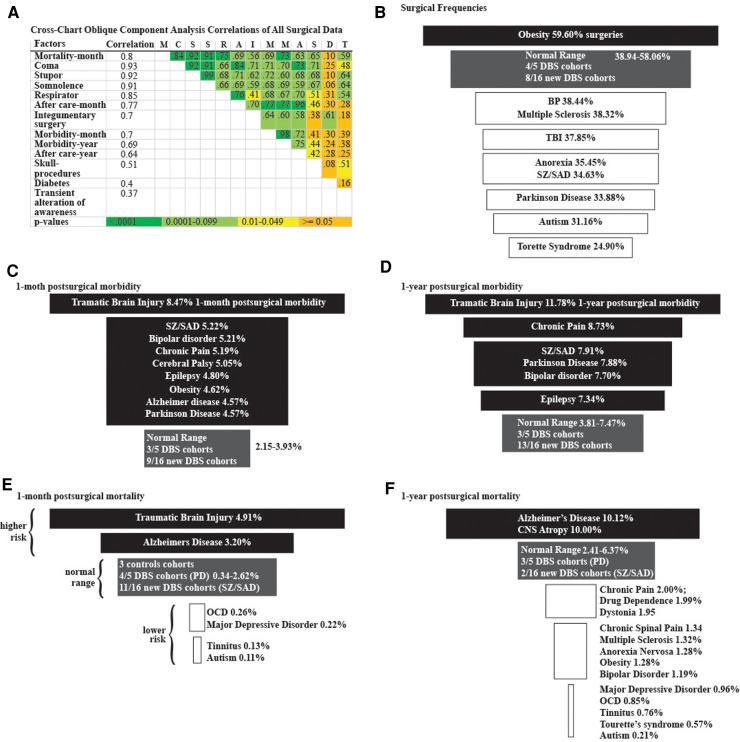
Figure 3.
Logistic regression analyses. (A) Cross-chart showing the group of 13 highly correlated surgical factors identified from 34,688,986 surgical cases using oblique component analysis. Correlation column is each factor's correlation to the group. Correlations between factors and color-coded p-values are listed in the cross-chart. Funnel plots of (B) surgical frequencies, (C) 1-month postsurgical morbidity, (D) 1-year postsurgical morbidity, (E) 1-month postsurgical mortality, and (F) 1-year postsurgical mortality among diagnostic cohorts. Higher frequencies (black), Normal-range frequencies defined by the results from the three control groups (grey), and lower frequencies (white).

