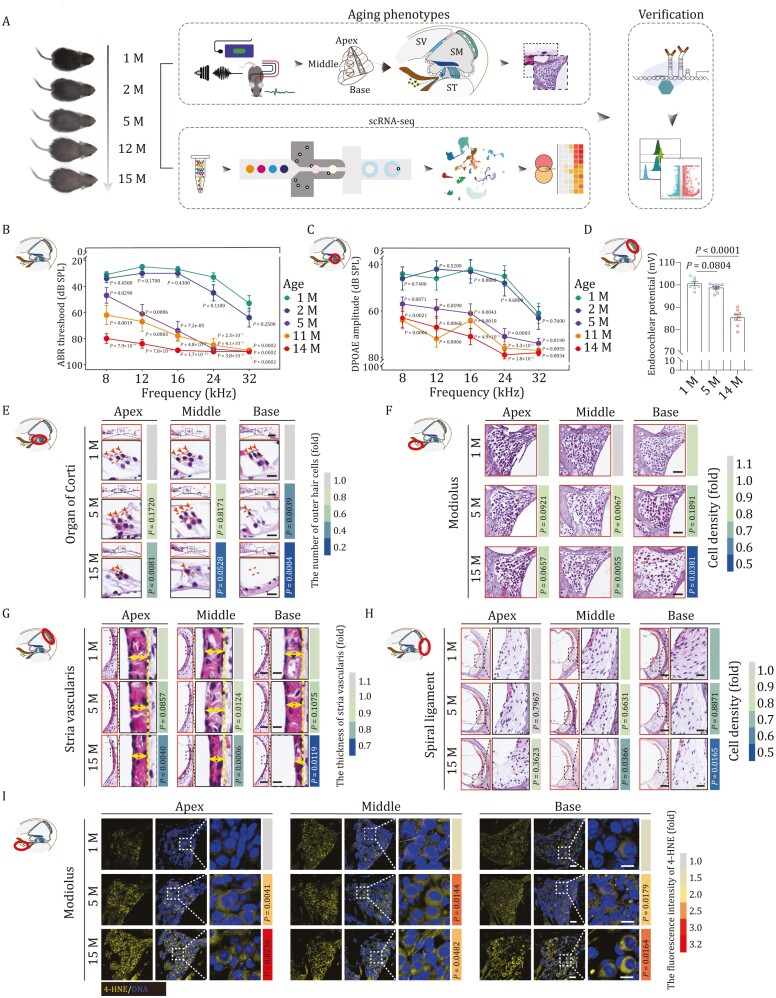
Figure 1.
Aging-related phenotypes of mouse cochlea. (A) Diagram showing the procedure of aging phenotypical analysis, single cell RNA sequencing (scRNA-seq), and subsequent verification of molecular mechanism. Month, M; Scala Vestibuli, SV; Scala Media, SM; Scala Tympani, ST. (B and C) Line charts showing ABR (B) and DPOAE (C) thresholds of 1-, 2-, 5-, 11-, and 14-month-old mice in response to different frequencies. The ABR or DPAOE thresholds of 2-, 5-, 11-, and 14-month-old mice were compared with those of 1-month-old mice. The quantitative data are presented as the mean ± SEMs (n = 10 mice). Two-tailed Student’s t-test P-values were indicated. Month, M. (D) A recording of the endocochlear potential of 1, 5, and 14 months old mice (1 M, n = 8 mice; 5 M, n = 10 mice; 14 M, n = 8 mice). Data were shown as the mean ± SEMs. Two-tailed Student’s t-test P-values were indicated. Month, M. (E) H&E-staining of outer hair cells in the apical, middle, and basal turns of cochleae from 1-, 5-, and 15-month-old mice. Scale bars, 40 and 10 μm (zoomed-in images). The cell number was counted and quantified. The number of cells is quantified as fold changes relative to that of apical turn in 1-month-old cochlea (n = 5 mice). Two-tailed Student’s t-test P-values were indicated. Month, M. (F) H&E staining of modiolus in the apical, middle, and basal turns from 1-, 5-, and 15-month-old mouse cochleae. Scale bars, 40 μm. The cell density is quantified as fold changes relative to that of apical turn in 1-month-old cochlea (n = 5 mice). Two-tailed Student’s t-test P-values were indicated. (G) H&E staining of stria vascularis in the apical, middle, and basal turns of cochleae from 1-, 5-, and 15-month-old mice. Scale bars, 40 μm and 10 μm (zoomed-in images). The thickness of stria vascularis was counted and quantified as fold changes relative to that of apical turn in 1-month-old cochlea (n = 5 mice). Two-tailed Student’s t-test P-values were indicated. (H) H&E staining of spiral ligament in the apical, middle, and basal turns of cochleae from 1-, 5-, and 15-month-old mice. Scale bars, 80 and 20 μm (zoomed-in images). The apical, middle, and basal spiral ligament cell density were counted and quantified as fold changes relative to that of apical turn in 1-month-old cochlea (n = 5 mice). Two-tailed Student’s t-test P-values were indicated. (I) 4-HNE immunofluorescence staining showed elevated intensity of 4-HNE in 5- or 15-month-old mice compared with that in 1-month-old mice. Scale bars, 40 and 10 μm (zoomed-in images). The relative intensity is quantified as fold changes relative to that of apical turn in 1-month-old cochlea (n = 5 mice). Two-tailed Student’s t-test P-values were indicated.

