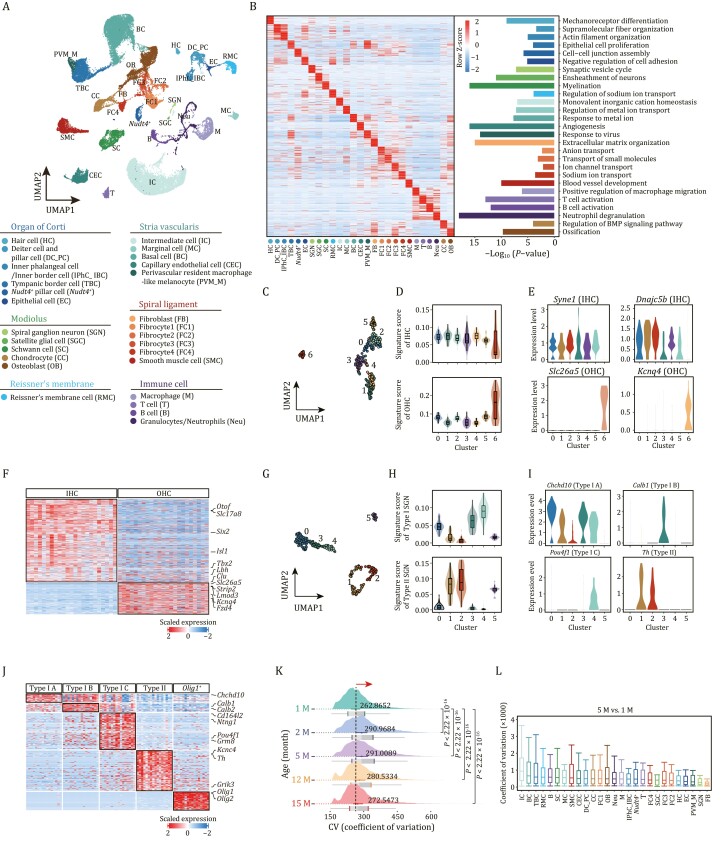
Figure 2.
Establishment of single-cell transcriptome landscape of mouse cochlea. (A) Top, UMAP plot showing the distribution of different cell types in cochlea. Bottom, the annotation of different cell types. HC, Hair cell; DC_PC, Deiter cell and pillar cell; IPhC_IBC, Inner phalangeal cell/inner border cell; TBC, Tympanic border cell; Nudt4+, Nudt4+ pillar cell; EC, Epithelial cell; SGN, Spiral ganglion neuron; SGC, Satellite glial cell; SC, Schwann cell; RMC, cells in Reissner’s membrane; IC, Intermediate cell; MC, Marginal cell; BC, Basal cell; CEC, Capillary endothelial cell; SMC, Smooth muscle cell; PVM_M, Perivascular resident macrophage-like melanocyte; FB, fibroblast; FC1, Fibrocyte 1; FC2, Fibrocyte 2; FC3, Fibrocyte 3; FC4, Fibrocyte 4; T, T cell; B, B cell; M, Macrophage; Neu, Granulocyte/neutrophil; CC, Chondrocyte; OB, Osteoblast. (B) Left, heatmap showing row z-score expression signatures of top 50 cell-type-specific genes. Right, representative Gene Ontology (GO) terms for marker genes. (C) UMAP plot showing the distribution of subclusters of HCs. (D) Violin and box plots showing the gene set scores of IHC (top) or OHC (bottom) signature genes in different subpopulations of HCs. Boxes show the medians and the quartile ranges (25%–75%), while the lengths of the whiskers represent 1.5× the IQR. (E) Violin plots showing the expression levels of select marker genes that are differentially expressed in IHCs and OHCs. Syne1 and Dnajc5b mark the IHCs. Slc26a5 and Kcnq4 mark the OHCs. (F) Heatmap showing the gene expression signatures of IHCs and OHCs. (G) UMAP plot showing the distribution of subclusters of SGNs. (H) Violin and box plots showing the gene set score of type I (top) or II (bottom) signature genes in different subpopulations of SGN. Boxes show the medians and the quartile ranges (25%–75%), while the lengths of the whiskers represent 1.5× the IQR. (I) Violin plots showing the expression levels of selected marker genes that are differentially expressed in types I and II SGN. (J) Heatmap showing the gene expression signatures of SGN subtypes. (K) Ridge plot showing the shift of CV of cochlear cells with age. P values by Wilcoxon test are indicated. (L) Box plot showing the CV of each cell type at 5-month-old compared to that of 1-month-old. Box shows the median and the quartile range (25%–75%) and the length of whiskers represents 1.5× the IQR.

