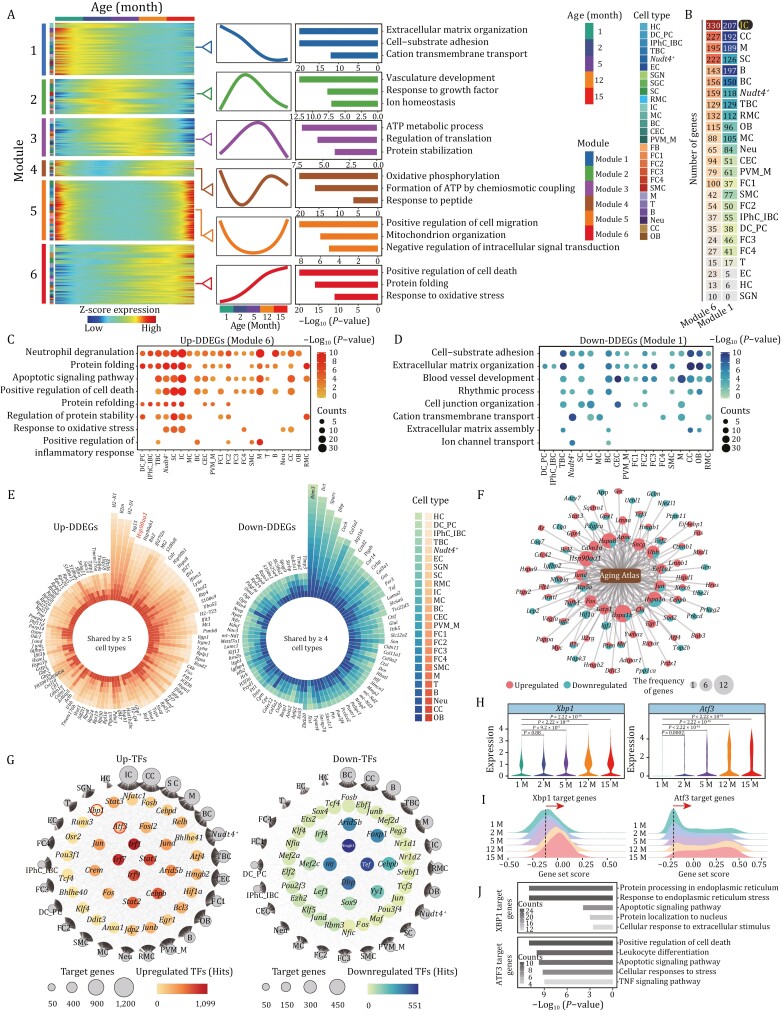
Figure 4.
Dynamic differential expression analysis uncovers transcriptional signatures during cochlear aging. (A) Heatmaps showing dynamic DEGs (DDEGs) with six different expression patterns. The corresponding gene expression trajectories and representative GO terms are shown in the middle and right panels. (B) Heatmap showing the number of upregulated DDEGs (module 6) and downregulated DDEGs (module1) in each cell type. (C and D) Representative GO terms of upregulated DDEGs (module 6) (C) and downregulated DDEGs (module 1) (D) in the different cochlear cell types. Count indicates gene number. (E) Plots showing the upregulated DDEGs (left) shared by at least five cell types and downregulated DDEGs (right) shared by at least four cell types. (F) Network plot showing the upregulated and downregulated DDEGs overlapped with genes annotated in Aging Atlas database. The node size indicates the frequency of DDEGs appeared across different cell types. (G) Network visualization of upregulated (left) and downregulated (right) core regulatory transcription factors (TFs) across all cell types during cochlear aging. Outer nodes represent different cell types, and the size of outer nodes indicates the number of target genes involved in this cell type. (H) Violin plots showing the expression levels of core transcription factors Xbp1 and Atf3 in 1-, 2-, 5-, 12-, and 15-month-old mouse cochleae. (I) Ridge plots showing the gene set scores of Xbp1 and Atf3 target genes in 1-, 2-, 5-, 12-, and 15-month-old mouse cochleae. (J) Representative GO terms enriched for XBP1 target genes (top) and ATF3 target genes (bottom). Count indicates gene number.

