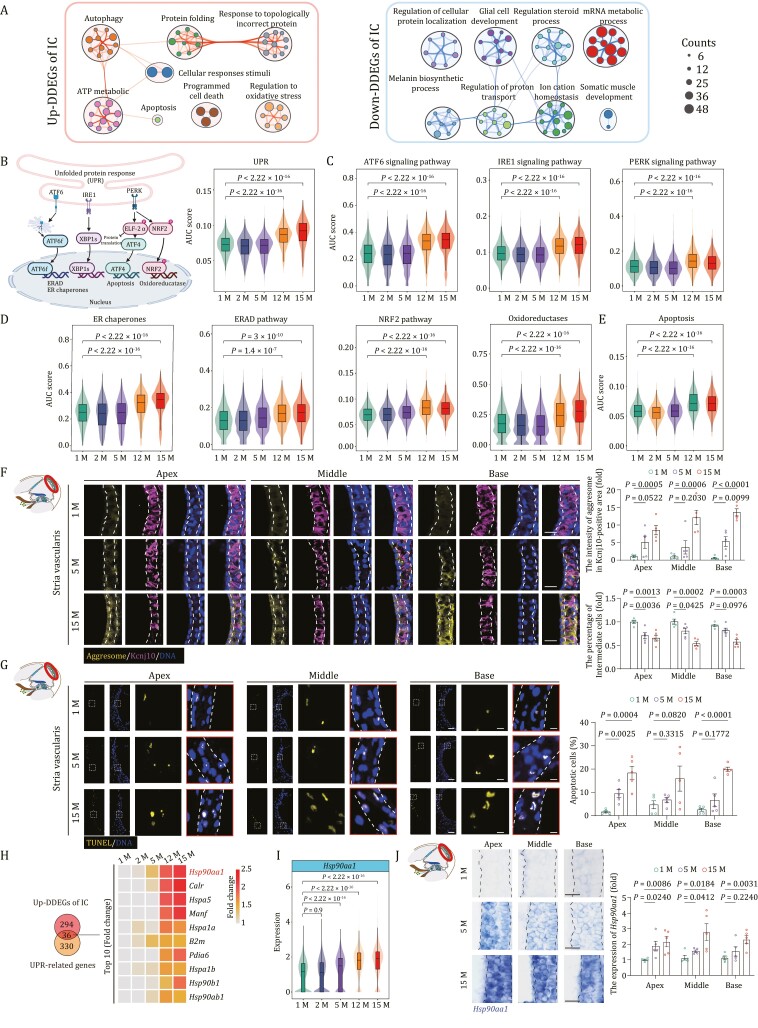
Figure 5.
Transcriptional profiles of intermediate cells during aging. (A) Network graph visualizing representative GO terms and pathways of upregulated DDEGs (left) and downregulated DDEGs (right) in intermediate cells. The size of the node is proportional to the total number of hits that fall into that specific term. Two terms with similarity > 0.3 are connected by a line. (B) Left, a schematic showing three principal branches and corresponding core components in the UPR pathway. Right, Violin and box plot showing the gene set scores of UPR pathway in intermediate cells across different time points. Box shows the median and the quartile range (25%–75%) and the length of whiskers represents 1.5× the IQR. P values by Wilcoxon test are indicated. (C) Violin and box plots showing the gene set scores of ATF6, IRE1, and PERK signal pathways in intermediate cells from 1-, 2-, 5-, 12-, and 15-month-old mice. (D) Violin and box plots showing the gene set scores of ER chaperones, ERAD and NRF2 pathways, oxidoreductases in intermediate cells from 1-, 2-, 5-, 12-, and 15-month-old mice. (E) Violin and box plot showing the gene set scores of apoptosis in intermediate cells from 1-, 2-, 5-, 12-, and 15-month-old mice. (F) Co-staining of aggresome and Kcnj10 in the 1-, 5-, and 15-month-old cochlear samples. Scale bars, 20 μm. The relative intensity of aggresomes in Kcnj10-positive areas and the relative number of Kcnj10-positive cells are quantified as fold changes and presented as the mean ± SEMs (n = 5 mice). Two-tailed Student’s t-test P values were indicated. (G) TUNEL staining in the 1-, 5-, and 15-month-old cochlear samples. Scale bars, 20 and 5 μm (zoomed-in images). The percentage of apoptotic cells was presented as the mean ± SEMs (n = 5 mice). Two-tailed Student’s t-test P-values were indicated. (H) Left, Venn diagram showing an overlap between upregulated DDEGs in intermediate cells and UPR-related genes. Right, heatmap showing the expression levels of the top 10 (accumulated fold changes) overlapping genes. (I) Violin and box plot showing the expression levels of Hsp90aa1 in intermediate cells from 1-, 2-, 5-, 12-, and 15-month-old mice. (J) RNA-ISH of Hsp90aa1 in cochlear SV from 1-, 5-, and 15-month-old mice. Representative images are shown on the left; the relative intensity of Hsp90aa1 is quantified as fold changes relative to that of apical turn in 1-month-old cochlea (n = 5 mice). Two-tailed Student’s t-test P-values were indicated. The values are shown as mean ± SEMs on the right. Scale bars, 20 μm. Month, M.

