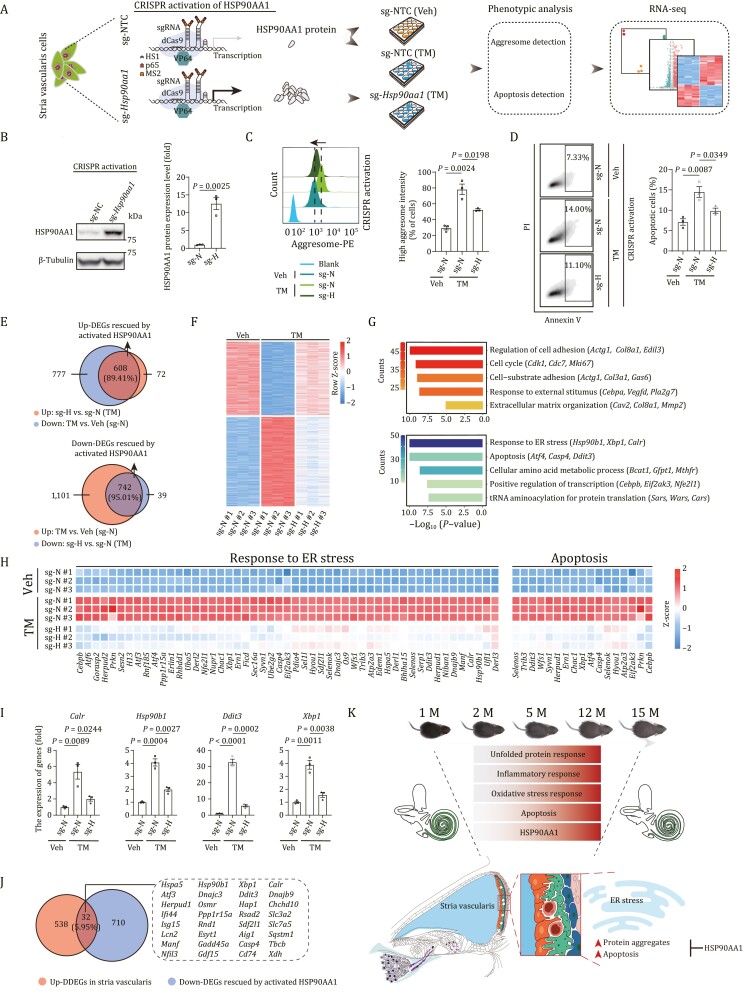
Figure 6.
Activation of HSP90AA1 prevents loss of proteostasis and alleviates apoptosis in stria vascularis cells. (A) Schematic of CRISPR-dCas9 transcriptional activation system-based HSP90AA1 activation and phenotypic and mechanism analysis. NTC, non-targeting control. Veh, vehicle; TM, Tunicamycin. (B) Western blot and band intensity quantification of HSP90AA1 protein levels in stria vascularis cells (SV-K1) transduced with non-targeting or Hsp90aa1-targeting sgRNA. Data are presented as the mean ± SEMs, n = 3 biological repeats. Two-tailed Student’s t-test P-value was indicated. Representative data from one of the three independent experiments. sg-N, sg-NTC; sg-H, sg-Hsp90aa1. (C) Left, aggresome intensity analysis of stria vascularis cells transduced with non-targeting or Hsp90aa1-targeting sgRNA after treatment with vehicle or tunicamycin. Right, data are presented as mean ± SEMs, n = 3 biological repeats. Two-tailed Student’s t-test P-values were indicated. Representative data from one of the three independent experiments. (D) Left, apoptosis analysis of stria vascularis cells transduced with non-targeting or Hsp90aa1-targeting sgRNA after treatment with vehicle or TM. Right, the percentages of apoptotic cells are presented as mean ± SEMs, n = 3 biological repeats. Two-tailed Student’s t-test P-values were indicated. Representative data from one of the three independent experiments. (E) Venn diagram showed the number and percentage of upregulated (top) and downregulated (bottom) DEGs rescued by activated HSP90AA1 upon TM treatment. (F) Heatmap showing the expression levels of upregulated and downregulated DEGs rescued by activated HSP90AA1 upon TM treatment. (G) Representative GO terms of upregulated (top) and downregulated (bottom) DEGs rescued by activated HSP90AA1. Count indicates gene number. (H) Heatmaps showing the relative expression levels of genes related to response to ER stress and apoptosis in different groups. (I) The relative expression levels of indicated genes by RT-qPCR. Data are presented as mean ± SEMs, n = 3 biological repeats. Two-tailed Student’s t-test P values were indicated. A representative data from one of the three independent experiments. (J) The Venn diagram showing the genes shared by downregulated DEGs rescued by activated HSP90AA1 and upregulated DDEGs of stria vascularis. (K) Schematic illustration of the phenotypic changes and molecular mechanism of cochlear aging in mice.

