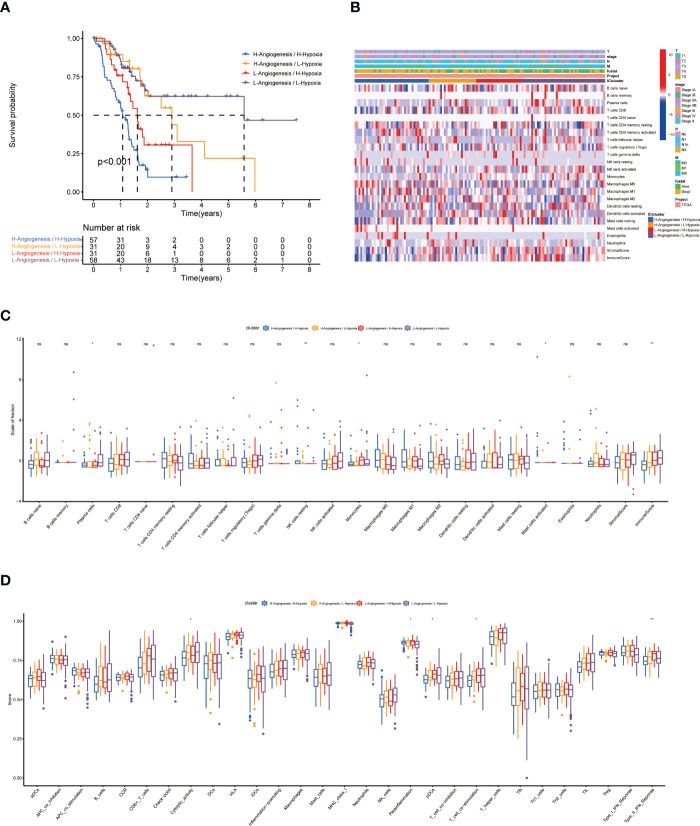
Figure 3.
Prognosis and related immunological information for patients with 4 subtypes. (A) KM survival curves for 4 subtypes. (B) Heat map of the distribution of clinical information and immune cell ratios in 4 subtypes. (C, D) Differential analysis of immune cell ratios and immune cell function in 4 subtypes. * indicates a significant difference between groups, p<0.05; ** indicates a significant difference between groups, p<0.01; "NS" no significant difference between groups, p≥0.05.

