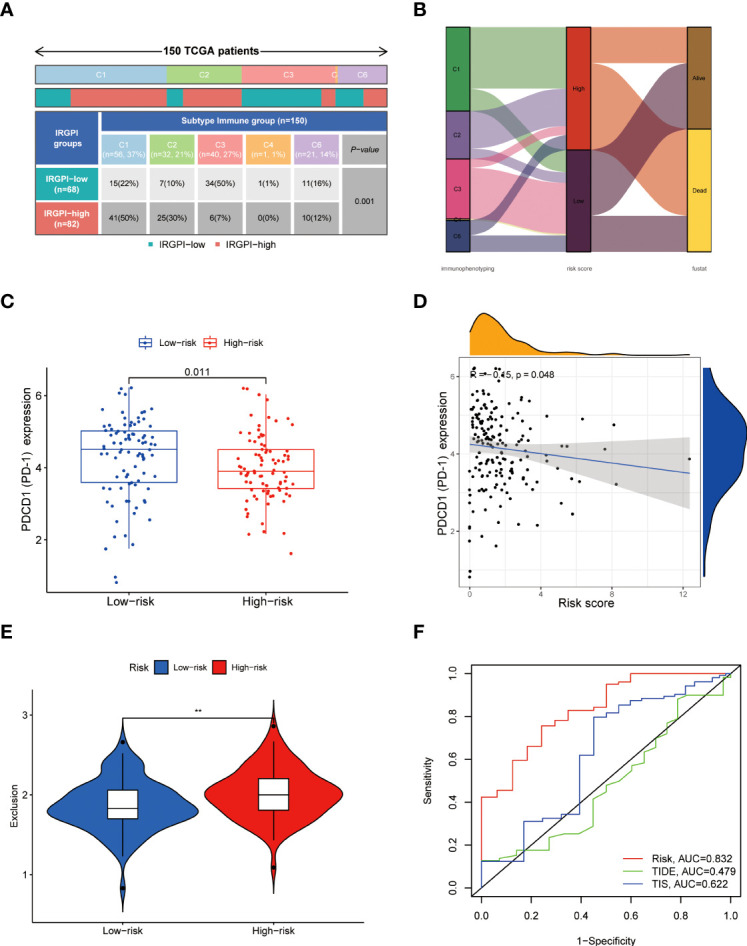
Figure 9.

Relationship between HAPM and immunotherapy. (A, B) Distribution of immunophenotyping between different subgroups. (C) Differences in PD-1 expression between different subgroups (TCGA-PAAD). (D) Correlation between HAPM and PD-1 (TCGA-PAAD). (E) Differences in T-cell exclusion scores between different subgroups. (F) ROC analysis of HAPM, TIS and TIDE on 3-year OS of TCGA-PAAD dataset.
