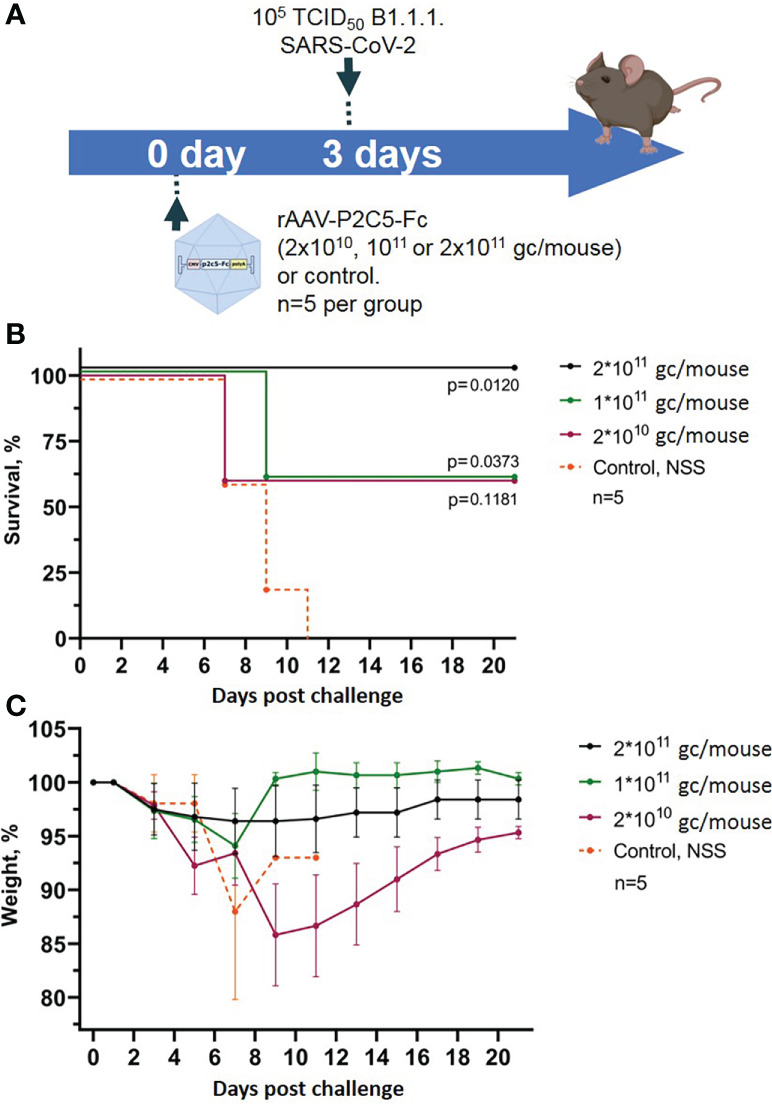
Figure 2.

Evaluation of rAAV-P2C5-Fc optimal dose. (A) Scheme of the experiment: mice were treated with different doses of rAAV-P2C5-Fc and challenged with 105 TCID50 SARS-CoV-2 B.1.1.1 variant on day 3 after the transduction. (B) Animal survival. (C) Body weight loss. Lines – mean values, error bars – SD, numbers indicate statistical significance evaluated compared with the vehicle group using a logrank test. Data from different rAAV-P2C5-Fc treatment groups are shown by color. Control, NSS – mice received normal saline solution. n – number of animals per group.
