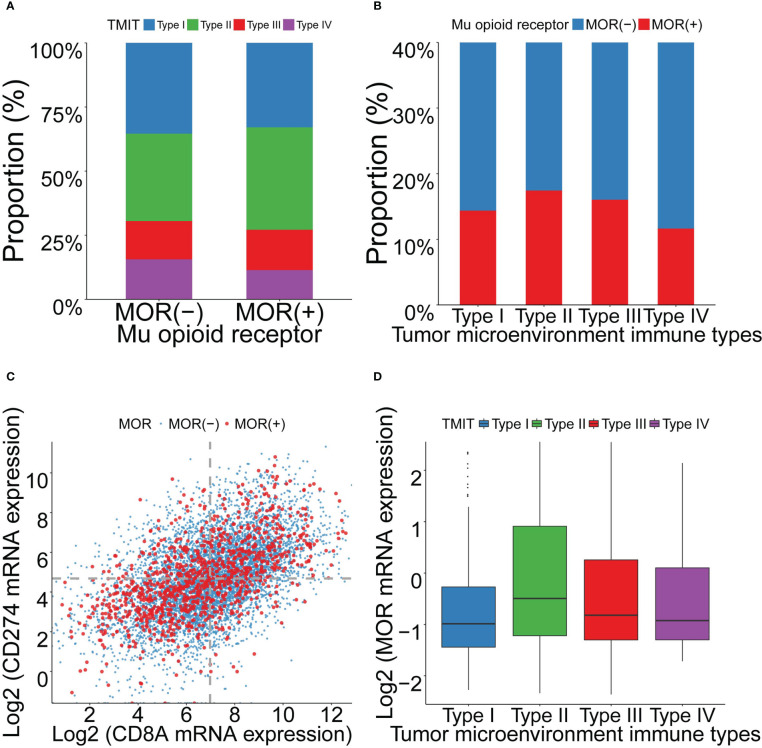
Figure 3.
Association between MOR mRNA expression and TMITs, as well as correlation between PD-L1 and CD8A expression across 18 cancer types. Footnotes: (A) Distribution of TMITs according to MOR expression. (B) Distribution of MOR expression according to TMITs. (C) Correlation between mRNA expression level of PD-L1 and CD8A. (D) The mRNA expression level of MOR according to TMITs.

