Figure 1.
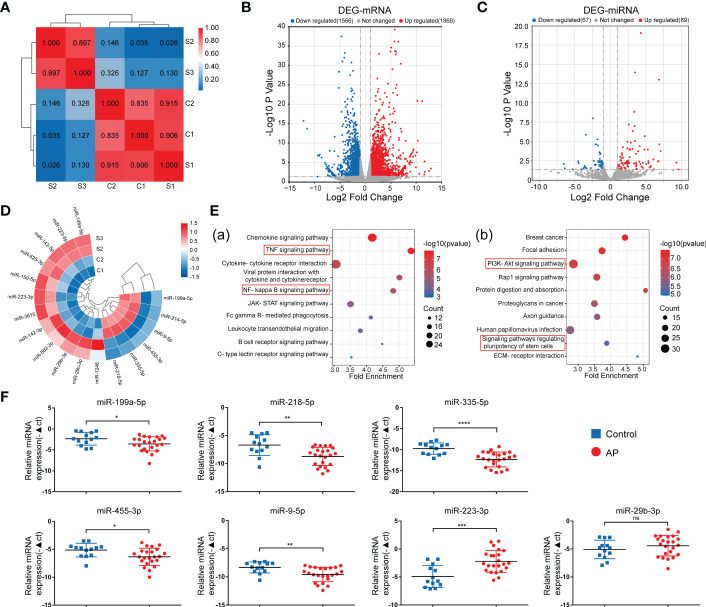
Identification of DE-miRNAs in periapical tissue. (A) Correlation analysis of the sequenced samples. (B) Volcano diagram of DE-mRNAs. (C) Volcano diagram of DE-miRNAs. (D) Circular heatmap of 12 up-regulated and 6 down-regulated miRNAs. (E) KEGG pathway enrichment analysis of the intersection genes between the DE-mRNAs and the predicted target genes of DE-miRNA. (F) Relative expression of the seven miRNAs in samples of periapical tissues (AP/Control:23/13). Data were presented as the mean ± SD. *p < 0.05, **p < 0.01, ***p < 0.001, and ****p < 0.0001, ns, no significance.

