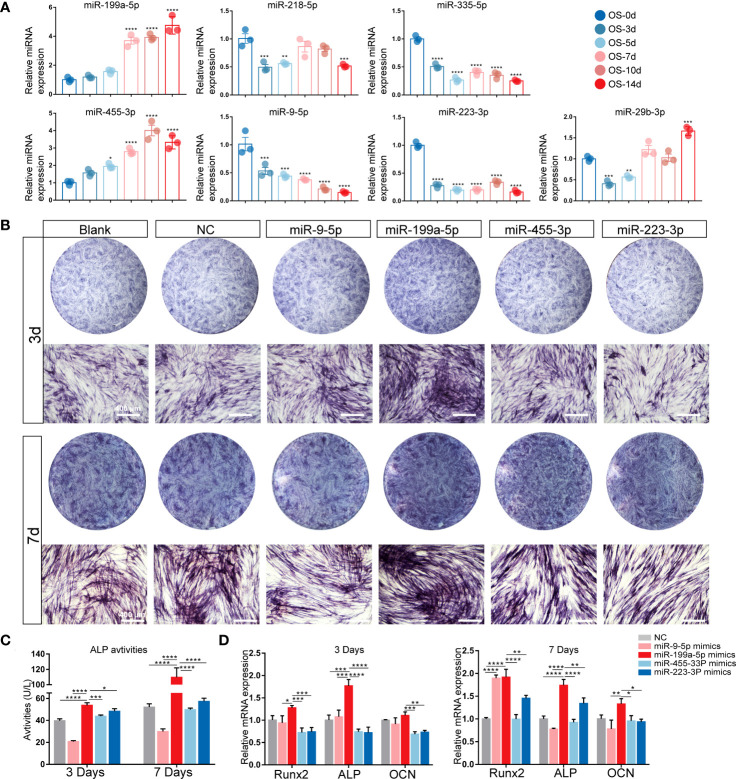
Figure 2.
Expression patterns of the candidate miRNAs during osteogenic differentiation of hSCAPs. (A) Relative expression of the 7 screened miRNAs. (B) ALP staining of different miRNA overexpression groups after 3 and 7 days of osteogenic induction (scale bar = 400 μm). (C) ALP activity in the different groups. (D) The relative mRNA expression level of osteogenic marker genes RUNX2, ALP, and OCN. The data were shown as mean ± SD. *p < 0.05, **p < 0.01, ***p < 0.001, and ****p < 0.0001.

