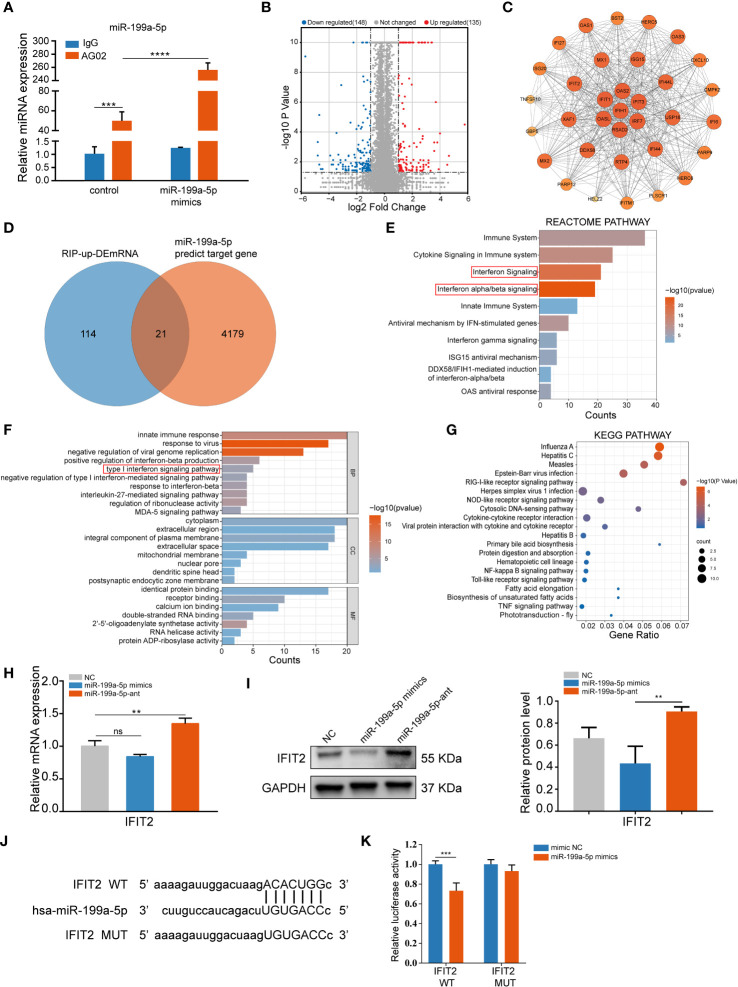
Figure 4.
miR-199a-5p directly targets IFIT2 in hSCAPs. (A) The relative expression level of miR-199a-5p in immunoprecipitates. (B) The volcano plot of differentially enriched mRNAs in the Ago2 immunoprecipitation complex between the miR-199a-5p overexpression and the control group. (C) Protein-Protein Interaction (PPI) analysis of the up-regulated genes. (D) Venn diagram of the intersection genes between the significantly up-regulated mRNAs (blue) and the predicted target genes of miR-199a-5p (orange). (E) Reactome pathway analysis of the up-regulated mRNAs. (F) GO analysis of the up-regulated mRNAs. (G) KEGG pathway enrichment analysis of the up-regulated mRNAs. (H) The relative expression level of IFIT2 at mRNA levels. (I) The protein expression levels of IFIT2. (J) Potential binding sites between lFIT2 and miR-199a-5p. (K) Dual-luciferase reporter assay. The data were shown as mean ± SD. **p < 0.01, ***p < 0.001, and ****p < 0.0001, ns, no significance.

