Figure 6.
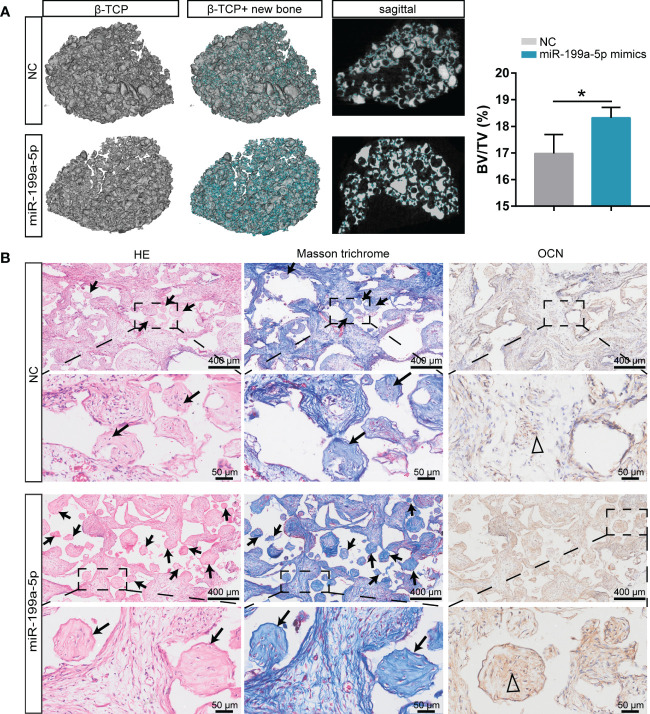
Overexpression of miR-199a-5p enhances hSCAPs osteogenic differentiation in vivo. (A) Left: Representative micro-CT images of 3D reconstruction and sagittal profiles of bone formation in β-TCP scaffolds of miR-199a-5p mimics (n = 3) and NC groups (n = 3). The blue areas: the region of new bone formation. Right: Quantitative analysis of BV/TV (%). The data were expressed as mean ± SD. *p < 0.05. (B) Representative images of H&E staining, Masson’s trichrome staining and immunohistochemical staining of OCN. The black arrows: bone formation. The triangle: positive cells.

