Figure 5.
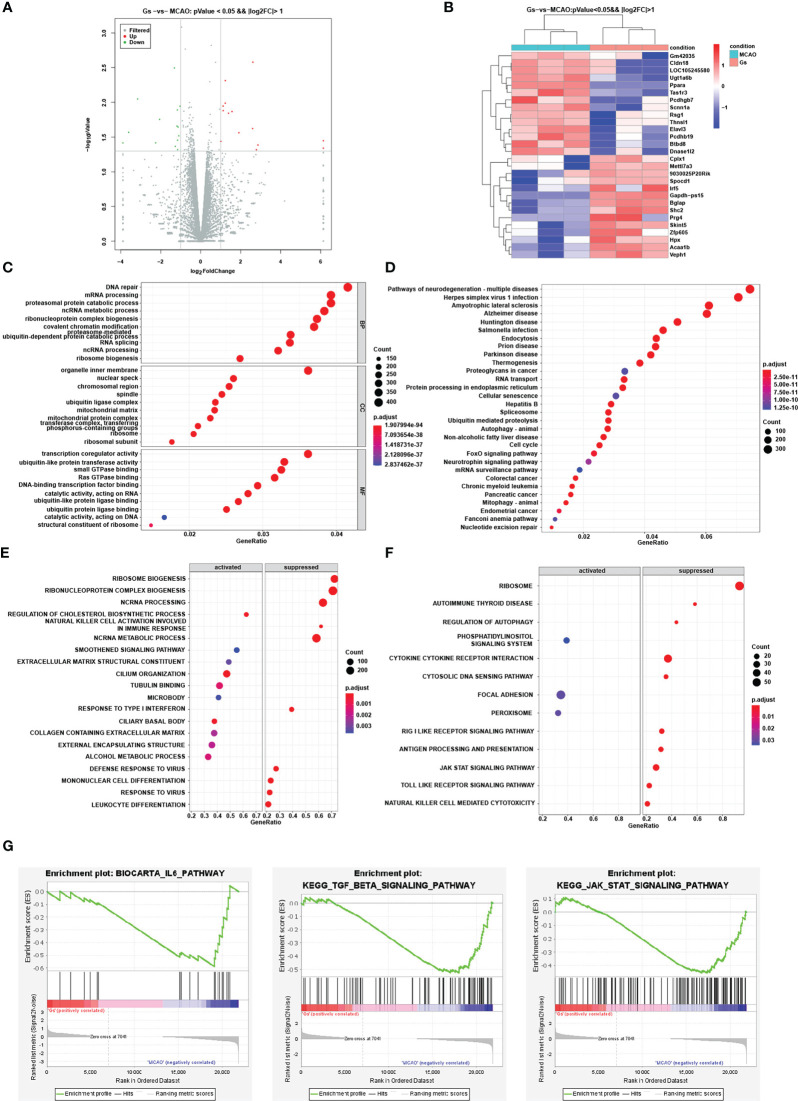
Analysis of the influence and pathways of Gelsevirine in the ischemia penumbra zone by RNA-seq. (A) Different expressed genes were showed by volcano and (B) the clustering analysis was showed by heatmap. (C, D) GO and KEGG enrichment were used to evaluate the influence of Gelsevirine on stroke. (E, F) GSEA method was used to GO and KEGG enrichment analysis which can explore the effect of Gelsevirine on stroke. (G) Important pathways related to inflammatory changes by GSEA analysis.

