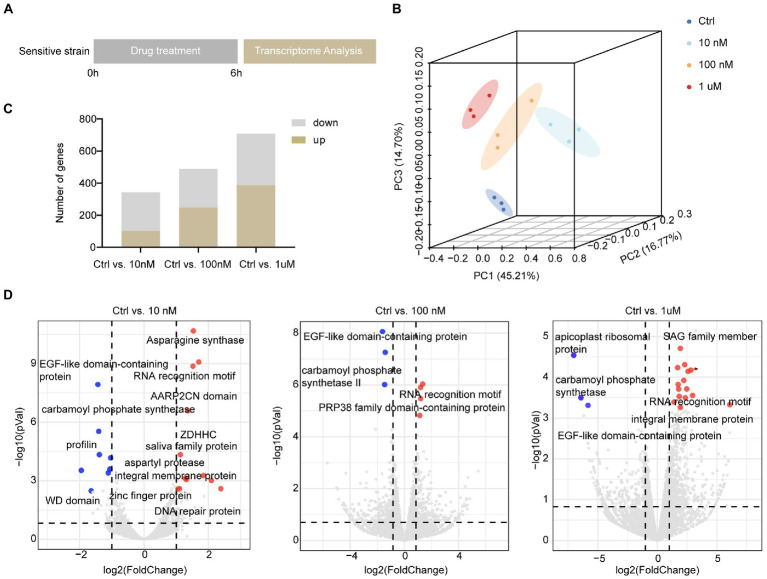
Figure 2.
Overall description of transcriptome data among different concentrations in sensitive E. tenella. (A) Schematic illustration of the halofuginone treatment and sampling strategies. Fresh sporozoites of sensitive E. tenella strains were treated with different concentrations (0, 10, 100 nM, and 1 μM) of halofuginone 6 h, respectively. Total RNA was then subjected to RNA-seq. (B) PCA plots for transcriptome samples labeled by different halofuginone concentrations. (C) Comparison of up-regulated and down-regulated numbers of DEGs under different concentrations, and a gene with a value of p less than 0.05 and a two-fold change was considered as a DEG. (D) Volcano plots showing the proportion of DEGs in different groups. The red dots represented up-regulated genes and the blue dots represented down-regulated genes, and the gray dots showed no significance.

