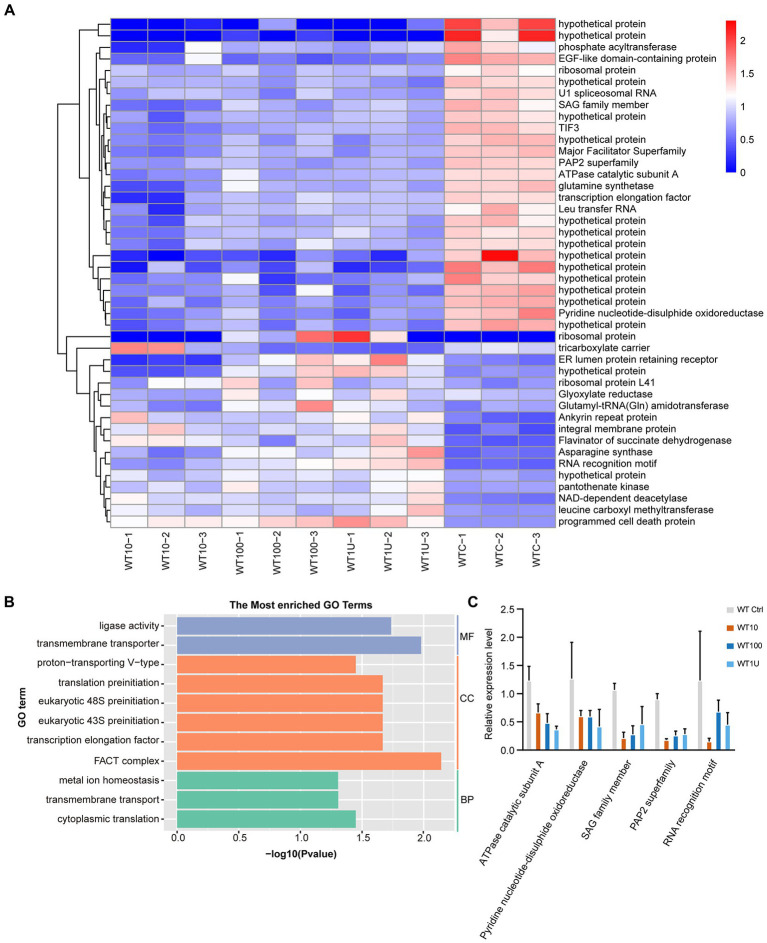
Figure 3.
Differential expression of genes shared among sensitive strains after halofuginone treatment (A) Heat map of the log2 fold change of significantly different genes among three treatment groups. Each treatment consisted of three biological replicates (B) Functional enrichment of shared DEGs among sensitive groups with different concentrations of halofuginone. The 11 most extensive GO terms of the three GO categories “molecular function” (blue), “cellular component” (orange), and “biological process” (green) are shown. (C) Verification of gene expression by real-time quantitative PCR. The black bars with standard errors indicate fold changes based on the relative expression level determined by qPCR using the 2−ΔΔCT method for three biological replicates.

