Figure 5.
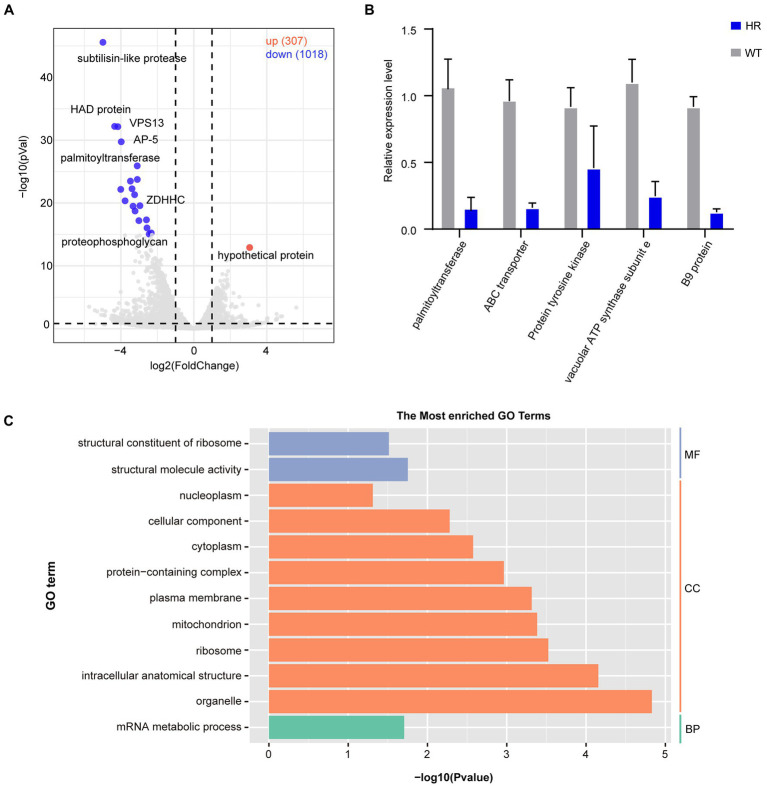
Differential gene expression after halofuginone induction. (A) Volcano plot showing the proportion of DEGs between the sensitive group and resistant group. The red dots represented up-regulated genes, the blue dots represented down-regulated genes, and the gray dots showed no significance. (B) Verification of gene expression by real-time quantitative PCR. The black bars with standard errors indicate fold changes based on the relative expression level determined by qPCR using the 2−ΔΔCT method for three biological replicates. (C) Functional enrichment of DEGs between halofuginone-sensitive and -resistant strains. The 12 most extensive GO terms of the three GO categories “molecular function” (blue), “cellular component” (orange), and “biological process” (green) are shown.

