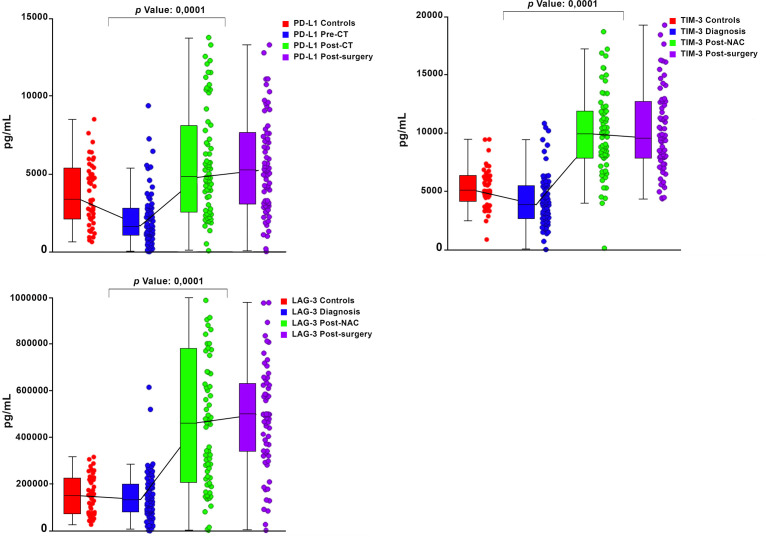
Figure 2.
Box and whisker plots depicting the progressive changes in the median plasma concentrations (with 95% confidence limits) of three co-inhibitory immune checkpoints (PD-L1, TIM-3 and LAG-3) throughout the course of neoadjuvant chemotherapy (NAC) (pre-treatment/diagnosis, post-NAC and post-surgery) in relation to the corresponding median values of the control subjects. The p values represent the comparison between the pre-treatment/diagnosis and post-NAC values.

