

Abstract
Organisms have been shifting their timing of life history events (phenology) in response to changes in the emergence of resources induced by climate change. Yet understanding these patterns at large scales and across long time series is often challenging. Here we used the US weather surveillance radar network to collect data on the timing of communal swallow and martin roosts and evaluate the scale of phenological shifts and its potential association with temperature. The discrete morning departures of these aggregated aerial insectivores from ground‐based roosting locations are detected by radars around sunrise. For the first time, we applied a machine learning algorithm to automatically detect and track these large‐scale behaviors. We used 21 years of data from 12 weather surveillance radar stations in the Great Lakes region to quantify the phenology in roosting behavior of aerial insectivores at three spatial levels: local roost cluster, radar station, and across the Great Lakes region. We show that their peak roosting activity timing has advanced by 2.26 days per decade at the regional scale. Similar signals of advancement were found at the station scale, but not at the local roost cluster scale. Air temperature trends in the Great Lakes region during the active roosting period were predictive of later stages of roosting phenology trends (75% and 90% passage dates). Our study represents one of the longest‐term broad‐scale phenology examinations of avian aerial insectivore species responding to environmental change and provides a stepping stone for examining potential phenological mismatches across trophic levels at broad spatial scales.
Keywords: aerial insectivore, aeroecology, birds, machine learning, migration, NEXRAD, phenology, radar remote sensing, roosts
Aerial insectivores are experiencing acute declines, making it critical to understand important phases of their annual cycle. The understudied pre‐migratory period, a phase where hundreds of thousands of individuals gather in roosts, offers a unique means to measure migration timing and changes therein under climate change. Using weather surveillance radar data from 12 stations around the Great Lakes region, we quantified the phenological patterns of roosting aerial insectivores over two decades. We found that peak and late roosting periods are shifting earlier and there is great within‐season synchrony among stations. Our study suggests that there is phenotypic flexibility in aerial insectivores responding to climate change.
1. INTRODUCTION
Anthropogenic climate change and its associated increasing temperature influences ecosystems at multiple scales (Inouye, 2022). Phenology is the study of recurring events in organisms' life cycles and their relationships with seasonal and interannual variation in climate (Schwartz, 2013). It is increasingly recognized that phenological changes are a common response to climate change (Menzel et al., 2006). Altered phenology has been documented in a variety of taxa across life stages, including changes in the timing of seasonal avian migration (Helm et al., 2019; Tryjanowski et al., 2002; Youngflesh et al., 2021), terrestrial vegetation green‐up date or first bloom date (Cleland et al., 2007; Panchen et al., 2015; Schwartz, 2013), large herbivores' reproduction (Aikens et al., 2021; Kerby & Post, 2013; Post & Forchhammer, 2008), aquatic insect emergence (Everall et al., 2015), and many others. The phenology of key species across these taxa could serve as indicators of ecosystem viability (Gittings et al., 2019). Since phenology is consequential for population dynamics, demography, and community structure (Diez et al., 2012; Miller‐Rushing et al., 2010), it is important to observe and quantify the potential shift, or lack thereof, of species' timing of annual events.
Avian aerial insectivore populations are experiencing acute declines, with species in North America experiencing a 31.8% population decline from 1970 to 2017 (Rosenberg et al., 2019). This decline is likely the result of multiple interacting drivers, including the large‐scale decrease in abundance of food resources in the form of aerial insects (Conrad et al., 2006; Rioux Paquette et al., 2014; Stepanian et al., 2020), breeding and nonbreeding habitat loss (Herkert, 1994; Holmes & Sherry, 2001), and climate change imparting selection pressure on species with less flexible migration phenology (Spiller & Dettmers, 2019). These proximate threats broadly influence aerial insectivores' annual cycle across breeding, migration, and nonbreeding seasons (Spiller & Dettmers, 2019).
While aerial insectivores' breeding biology is widely studied (Dunn & Winkler, 1999; Imlay et al., 2018; Neufeld et al., 2021; Saldanha et al., 2019), fewer studies focus on their unique post‐breeding and pre‐migratory period. Potentially due to less obvious and uniform migration patterns under less time constraints during this period, post‐breeding phenology of migratory birds is still poorly understood (Gallinat et al., 2015; Haest et al., 2019; La Sorte et al., 2015). This study offers a unique angle on this understudied part of aerial insectivores' life history. After the breeding season, swallows and martins of all ages in North America transition to pre‐migratory roosts in late June and July, some of which contain more than 100,000 birds (Russell & Gauthreaux, 1999). In the northern United States, summer roosts of aerial insectivore species are largely composed of Purple Martins (Progne subis), but also include Tree Swallows (Tachycineta bicolor), Barn Swallows (Hirundo rustica), Bank Swallows (Riparia riparia), and Cliff Swallows (Petrochelidon pyrrhonota) (Bent, 1963; Burney, 2002; Kelly et al., 2012; Kirby, 1978). Their communal roosting behaviors, where unrelated conspecifics and heterospecifics aggregate during the nocturnal resting period (Laughlin et al., 2014) present a unique means of examining the timing of a critical life‐history stage, when insectivores refuel to offset the energy demands of fall migration (Imlay & Taylor, 2020). Birds disperse from roost sites synchronously within 1 h before dawn for daily foraging bouts over a large surrounding area and return to the roost 1–2 h before sunset (Bridge et al., 2016; Brown et al., 2021). Roosts may persist on the landscape for 8–12 weeks, but as the season progresses, birds continue their southbound migration, with roosts all but disappearing in North America by mid‐October (Brown et al., 2021). This discrete roosting behavior can be captured on a macroscale using a remote sensing platform—weather surveillance radar (Laughlin et al., 2013).
The use of next‐generation weather surveillance radars (NEXRAD) in biological applications has contributed greatly to our understanding in many areas of ecology. Aeroecology, which is a field of study mostly concerning the movements and behaviors of airborne animals, namely birds, insects, and bats, has been greatly assisted by NEXRAD sensors. Those studies include examinations of avian nocturnal migration on a large spatial and temporal scale (Dokter et al., 2018; Horton et al., 2015, 2020; Nilsson et al., 2019), insect migration or abundance (Stepanian et al., 2020; Westbrook et al., 2014), bat emergence from caves and bridges (Haest et al., 2021; Horn & Kunz, 2008; Stepanian & Wainwright, 2018), stopover site and nesting site identification (Bigger et al., 2006; Bonter et al., 2009; Lafleur et al., 2016), as well as population and behavioral responses to human‐introduced disturbances (Cabrera‐Cruz et al., 2020; Horton, Nilsson, et al., 2019; Horton, Van Doren, et al., 2019; McLaren et al., 2018; Van Doren et al., 2017, 2021). While previous studies have leveraged this infrastructure for the study of roost identification (Bridge et al., 2016; Cheng et al., 2020; Chilson et al., 2019; Kelly & Pletschet, 2018; Laughlin et al., 2014; Russell & Gauthreaux, 1998), little has been done to quantify long‐term phenology patterns of aerial insectivore roosting behaviors.
Temperature‐associated shifts in life history timing have been reported in some insectivore species. For example, advances of lay dates in long‐distance migratory Pied Flycatchers (Ficedula hypoleuca) were partly explained by ambient temperature on the breeding grounds (Helm et al., 2019), and warmer winter temperature on the breeding grounds predicted earlier breeding in Tree Swallows likely through insect availability (Imlay et al., 2018). While aerial insectivore phenology may be directly correlated to insect prey phenology (Shutler et al., 2012), long‐term measures of aerial insect distributions and their timing are still challenging to acquire. Therefore, air temperature may serve as a proxy for aerial insect phenology since growing degree days (GDD, a measure of heat accumulation) are tightly coupled with the timing of insect emergence (Everall et al., 2015).
The Great Lakes region is an important ecoregion for millions of en route migratory birds (Diehl et al., 2003) and it is known that many insectivore species form pre‐migratory roosts in this region, near water or crop fields (Bent, 1942; Bridge et al., 2016). The goal of this study was to use long‐term radar data to quantify swallow and martin roosting phenology change and phenological plasticity in the Great Lakes region for the first time, as well as to explore the influence of air temperature on roosting timing.
2. MATERIALS AND METHODS
2.1. Radar sites and system specification
The US Next‐generation Radar (NEXRAD) network consists of 159 S‐band radars and is operated by the National Oceanic and Atmospheric Administration (NOAA). Data collection from these remote sensors began in the early 1990 s and has been consistent for many stations since the mid‐1990 s (Chilson et al., 2012; Stepanian et al., 2016; Figure S1). NEXRAD radar products are archived and fully accessible via Amazon Web Services (https://s3.amazonaws.com/noaa‐nexrad‐level2/index.html). Not only is it a reliable tool to monitor weather activity, but it also provides an opportunity to monitor animal airspace usage, including migration and dispersal (Kelly et al., 2012; Laughlin et al., 2013). From a radar perspective, swallows and martins show distinct morning exoduses as they emerge from nightly roosting locations, which appear as ring‐shaped patterns expanding outwards from the initial roost locations. In the Great Lakes region, these “roost rings” populate radar imagery from late June to late October (Laughlin et al., 2013). To quantify the timing of aerial insectivore roosting phenology, we extracted roost signals from radar imagery from 21 years of data (2000–2020) across 12 radar stations throughout the Great Lakes region (Figure 1). To capture the dispersal of insectivores emerging from roosts, we selected radar scans from 30 min before sunrise until 90 min after sunrise from June 1st to October 31st.
FIGURE 1.
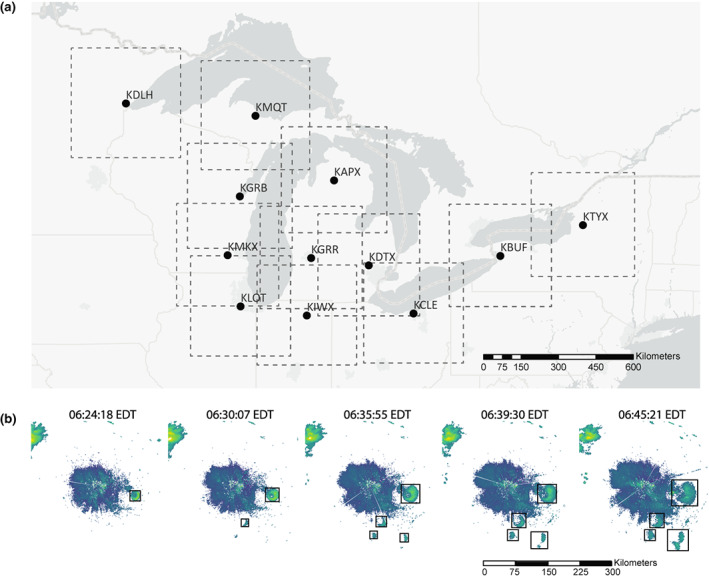
(a) Location of 12 radar stations across the Great Lakes region. The square buffer around each site indicates a 300 × 300 km detection range. Four‐letter radar station names represent the following locations: KDLH = Duluth, Minnesota; KMQT = Marquette, Michigan; KGRB = Green Bay, Wisconsin; KMKX = Milwaukee, Wisconsin; KLOT = Chicago, Illinois; KIWX = Fort Wayne, Indiana; KGRR = Grand Rapids, Michigan; KAPX = Gaylord, Michigan; KDTX = Detroit, Michigan; KCLE = Cleveland, Ohio; KBUF = Buffalo, New York; KTYX = fort drum, New York. Map lines delineate study areas and do not necessarily depict accepted national boundaries. (b) Five successive radar reflectivity images (6:24 AM, 6:30 AM, 6:35 AM, 6:39 AM, 6:45 AM) from KDTX station on the morning of August 18, 2005, showing detection bounding boxes around each roost.
These 12 radar stations operate at S‐band, with a wavelength of approximately 10.71 cm (ranges from 10.02 to 11.09 cm) and 2.7–3.0 GHz frequency. Airspace is sampled by the predetermined volume coverage patterns (VCPs), which vary in the number of beam sweeps and the amount of time needed to complete a volume scan ranging from 5 to 10 min. At each radar station, data are collected as the radar antenna scans 360 degrees at different elevation angles, ranging from as few as five unique elevational scans to as many as 15. The scans are organized into discrete azimuths and range gates. In 2008, the spatial resolution was increased from 1.0° azimuths and 1 km range gates (legacy resolution) to 0.5° azimuths and 250 m range gates (super‐resolution). In 2013, the network was upgraded to dual‐polarization, adding three more radar products (total measured differential phase, differential reflectivity, copolar correlation coefficient) to the original standard radar moments (radar reflectivity factor, radial velocity, spectrum width). Copolar correlation coefficient () has proven useful in separating precipitation from biological scatters (Stepanian et al., 2016), as it was used in this capacity for this study when available. The beam samples the atmosphere at greater heights with increasing distance from the radar because radar beam geometry under the standard atmosphere refraction is assumed to be 4/3 of Earth radius, as well as radar beam tilts usually start from 0.5° elevation angle. For this reason, we restricted our extractions to 150 km from each radar station (within a 300 × 300 km square bounding box centered at the radar) to ensure roosts would be visible within the radar beams. We acknowledge the influence of range on roost detections, specifically, roosts that are far away from or too close to the radar are likely to be underestimated or missed. However, detection bias introduced by the range effect would be stable across years, thus not broadly impacting macro‐phenology patterns that we are examining.
2.2. Automatic detection and validation through manual screening
Historically, it has been challenging to separate swallow and martin roost rings from non‐biological information (e.g., precipitation) and other biological activities showing up on radar scans (e.g., insects, bats, other birds). Without an automatic system, it is also prohibitive, particularly when manual detection is the only tool, to process large amounts of data covering a long time‐series and large spatial extent. To tackle these challenges, we leveraged a deep‐learning system introduced by Cheng et al. (2020) to automatically detect and track roosts in radar scans. This system consists of two modules: first, a single‐frame detector was built on Faster R‐CNN (Ren et al., 2017) to identify and localize the roosts per radar scan by predicting the probability that a roost of each candidate size exists near each reference position (45 reference anchors ranging from 16 × 16 to 512 × 512). Faster R‐CNN is a widely deployed and highly cited region‐based CNN (convolutional neural network) detector, which simultaneously classifies and localizes objects. Second, we used a tracking algorithm (Ren et al., 2017) to associate roost detections across temporally consecutive scans. The roost identification algorithm was trained on a manually annotated roost dataset collected in previous roost studies (Cheng et al., 2020; Laughlin et al., 2016), which consists of 88,972 radar scans with 63,691 labeled roosts. Following Cheng et al. (2020), we render 3 channels of radar products (reflectivity at 0.5° tilt, radial velocity at 0.5° tilt, and reflectivity at 1.5° tilt) as 600 × 600 pixels (1 pixel = 0.5 km) images in the “top‐down” Cartesian‐coordinate view and finetune a detector pretrained on a large‐scale natural image dataset (Russakovsky et al., 2015). The resulting system detections are given by a class probability and bounding box coordinates for each roost (Figure 1b). Lastly, to remove additional false positive detections, we used dual‐polarization radar products to mitigate weather contamination and an existing wind turbine database (Hoen et al., 2018) to remove returns from those stationary ground‐based targets. We refer the readers to Cheng et al. (2020) for more technical details.
While the automated detector accurately identified the location of most roosts, it was also prone to some errors introduced by non‐biological targets or unknown noises. To ensure confidence in our detections, we (YD, MCB, and VS) manually screened all detections to remove false positives, including contamination from precipitation and anomalous propagation, and we worked to ensure that bounding boxes appropriately estimated the boundaries of the roosts. A rigorous screening protocol was developed to ensure consistency among three screeners. During the screening, days with more than 50% of the radar domain contaminated by precipitation or anomalous propagation were discarded. Different labels were created for detections of roosts: non‐roosts, weather‐contaminated roosts, anomalous propagation roosts, unknown‐noise roosts (roosts with strong scattered undefined signals in the background), and bad tracks. Bad tracks were defined as detection tracks that failed to follow the typical roost emergence and disappearance pattern, stopped early, jumped to track another roost or other objects, continued tracking when roosts already disappeared, or captured bounding boxes that were too large or too small. This extensive screening effort will help improve the roost detection algorithm performance in the future, as well as provide us with information of potential noises introduced by the environment and radar system.
After the screening process, we tested if the number of roost detections differed before and after super‐resolution and dual‐polarization upgrades. We calculated the mean number of unique roost tracks detected within each radar station across all years before and after the upgrades, then we conducted paired sample Wilcoxon tests (non‐parametric due to non‐normal distributions) in R. We did not find significant differences between pre‐upgrade and post‐upgrade roost detections for super‐resolution and dual‐polarization upgrades (Figure S2).
2.3. Radar data processing
To estimate the number of swallows and martins within each roost, we extracted the raw reflectivity factor values from Level II weather radar data and translated it into the number of birds (Chilson et al., 2012; Diehl et al., 2003; Dokter et al., 2011; Gauthreaux & Belser, 1998; Nebuloni et al., 2008). Specifically, we converted radar reflectivity factor (dBZ) to radar reflectivity (cm2/km3) in the linear scale, which is directly related to the density of bioscatterers, using
where with for liquid water, and (typical value for WSR‐88D S‐band; wavelength of these 12 radars ranges from 10.02 to 11.09 cm).
Purple Martins are the largest species in Hirundinidae family in North America, so we used its radar cross section (RCS) to produce conservative estimates of the number of birds. Assuming all birds are uniformly distributed within the radar sampling volume and using a RCS for Purple Martins of 16.2 cm2 according to the linear relationship between bird mass and radar cross section (Horton, Nilsson, et al., 2019; Horton, Van Doren, et al., 2019):
and mean purple martin mass of 51 g (Dunning, 2007), we calculated a number density D bio and number of birds per roost N bio for each roost detection at each tilt using
where is the volume of a voxel, which is a sampling unit in a three‐dimensional cone cut by two parallel planes 250 m apart. We calculated the volume of each voxel of the radar sampling volume by assuming a 1° symmetric circular conical beam width for legacy‐resolution scans (before the 2007–2008 Super Resolution upgrade), and an elliptical conical shape of 1° vertical beam width and 0.5° horizontal beam width for super‐resolution scans (Torres, 2007). Lastly, we summarized the cumulative number of birds below the height of 5000 m by adding up the averaged bird counts in each standardized elevation angle bin (1‐degree interval). All radar data processing was done in Python (version 3.9.4) using PyArt and pywsrlib packages and R (version 4.0.2).
2.4. Quantifying phenological trend
We explored phenological trends at three spatial levels: persistent local roost clusters, radar stations, and the Great Lakes region. Roost clusters were generated by a mean shift clustering algorithm (Pedregosa et al., 2011) using our roost track detections, which calculated density‐based clusters while maintaining a minimum shape (Belotti et al., in review). First detection points included in the same cluster represent a region consistently used by swallows and martins to roost in a local region, thus defined as a roost cluster. We defined persistent roosts as those that had roosting activity in 90% or more of available years (i.e., >18 years). We excluded station‐years or roost‐years that had fewer than 10 days with roost detections from the analysis. Following the manual screening, we filtered for detections labeled as swallow‐roosts and excluded detections with all other labels (e.g., bad track, weather contamination, etc.). To calculate the daily bird count for each station‐year, we derived the mean number of birds for each roost track, then summed up all the birds from all roosts detected in a day within a station. We excluded the days from the analysis if there was more than 50% weather contamination in the radar scanning area, intense anomalous propagation, or the sampling period of the day was less than 100 minutes. Days without any detections and not excluded from the analysis were filled as true zeros.
To estimate potential changes in different roosting phenology stages at persistent roost cluster and radar station scales, we first used a generalized additive model (GAM) fit to each station‐year and roost‐year to model the roosting activity throughout a roosting season, using R package mgcv (Wood, 2011). We constructed GAMs with daily bird counts as the response variable and day of year (DOY) as the independent variable with the smoothing parameter (k) set to 5 using a quasi‐Poisson correction for overdispersion, with thin plate regression splines (tp) smooth term and REML smoothing parameter estimation method. We used this model construction to predict counts throughout the season. From these predicted counts, we calculated the 10th, 25th, 50th, 75th, and 90th percentile dates and mean dates as phenology estimates since we want to capture the phenological trend at different stages of roosting. Each percentile date is the first date by which a certain percent of the cumulative bird count has been reached. We also included the mean date since estimating trend using mean date is often most accurate, as well as robust to variation in sample sizes (Moussus et al., 2010). The mean date is calculated as the mean passage date weighted by the bird counts at each date over the whole sampling period of a year. To extract each phenology estimates at the Great Lakes region level, we calculated weighted passage dates using station level phenology estimates weighted by log‐transformed cumulative passage in each year. Taking year as an independent sampling unit, we tested for long‐term trends for phenology using a linear regression model at all three different scales. To compare the long‐term phenology trends to the results found in other literature (Horton et al., 2020), we conducted a non‐parametric Wilcoxon test (small sample size and not normally distributed) for paired samples to assess if the phenology trends are significantly different across the Great Lakes region.
The distributions of peak roosting activity dates across stations were tested for normality using the Shapiro–Wilk test. Since the hypothesis of normality was not met for all the stations, we used non‐parametric tests (Kruskal–Wallis test and Fligner‐Killeen test of homogeneity of variances) to test for differences in means and variances of the peak roosting activity timing across stations.
2.5. Air temperature as an indicator of phenology change
To examine the association between air temperature and aerial insectivore roosting phenology, we used air temperature 2 m above ground (°C) gridded at 32‐km from NCEP North American Regional Reanalysis (NARR) data archive (https://psl.noaa.gov/data/gridded/data.narr.html), which is available from 1979 to the present and measured 8 times daily. We calculated the daily mean temperature for the entire study region and within the 150 km buffer area around each station during the active roosting months (July 1st to September 30th). Seasonal means of mean temperatures were then calculated for each year and each station. To quantify the trend in surface air temperature, we used a linear regression with year and radar ID as fixed effects for region level analysis, and year as fixed effect for station level analysis. To test if surface air temperature was predictive of roosting phenology interannual variations, we fit linear regressions for each station and the whole region using all six phenology estimates to relate roosting phenology to air temperature. To examine the relationship between trends in temperature and roosting phenology, we conducted linear regression analysis at the station level. All analyses were conducted in R (version 4.0.2).
3. RESULTS
3.1. Descriptions of aerial insectivore roosting phenology
We sampled 3192 mornings for 12 radar stations across the Great Lakes Region from 2000 to 2020. In total, we processed and screened 940,641 radar scans, within which we obtained 67,273 detections of roosts, grouped into 16,222 tracks (non‐duplicated) by the machine learning algorithm. Across this period, 85.32% of the total tracks were identified as swallow and martin roosts (non‐contaminated and well tracked). Each station‐year had a mean of 60.4 unique roost tracks detected (SD = 43.2). Some martin roosts were discarded in the analysis due to anomalous propagation (0.6%), imperfect tracking (3.8%), unknown noise (7.3%), and weather contamination (2.9%). After filtering out the years with roost detections on fewer than 10 days, we excluded radar station KMQT (located at Marquette, Michigan) from the analysis since it did not meet this criterion.
Swallow and martin roosting activity (mean daily bird count across all stations and years) increased from early August [10% passage date: 212 ± 7.78 (±SD) DOY; 25% passage date: 220 ± 5.89 (±SD) DOY], peaked in mid‐August [50% passage date: 227 ± 5.69 (±SD) DOY; mean date: 227 ± 4.66 (±SD) DOY], and then declined in late August [75% passage date: 234 ± 6.21 (±SD) DOY; 90% passage date: 240 ± 7.20 (±SD) DOY] in the Great Lakes region (Figure 2a,b). Means in peak roosting activity dates did not differ across stations (Figure 2c, Kruskal‐Wallis test: chi‐squared = 9.2065, df = 10, p‐value = .5126), however, variances in peak roosting activity dates differed across stations (Figure 2c, Fligner‐Killeen test of homogeneity of variances: chi‐squared = 19.802, df = 10, p‐value = .03118). To examine the pair‐wise correlations between 50th percentile passage date at each station, we calculated Pearson's correlation coefficients. We found that the timing of events was positively correlated with each other at majority of the stations and all significant (p < .05) correlations were positive (Figure 3; Figure S3).
FIGURE 2.
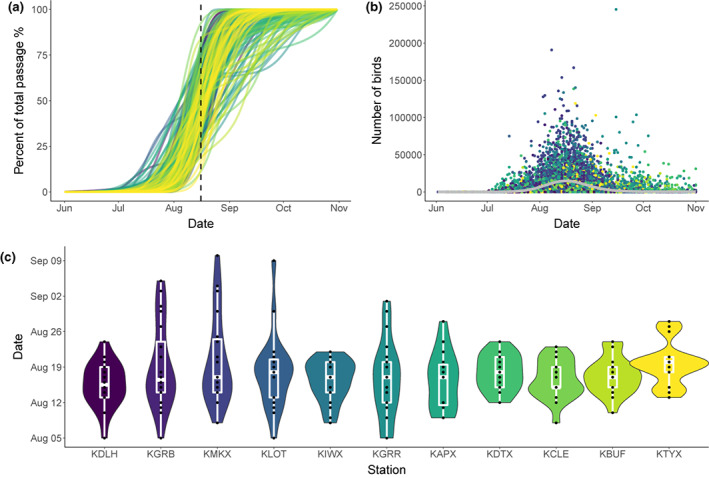
(a) Seasonally cumulative roosting activity for 11 radar stations in the Great Lakes region from 2000 to 2020. Each curve represents a unique station‐year. Averaged peak roosting activity date (August 16th) is shown with a dotted vertical line. Color corresponds to the radar station as shown in (c). (b) Scatter plot of raw daily sum of the number of birds from all station years, showing the general pattern of roosting activity in the Great Lakes region over 21 years. The fitted line is derived from a generalized additive model (GAM). Color corresponds to the radar station as shown in (c). (c) Violin plot of peak roosting activity dates (50% passage) in each radar station from 2000–2020. Radar stations are sequenced in the order along the southern coastline of the Great Lakes (west to east).
FIGURE 3.
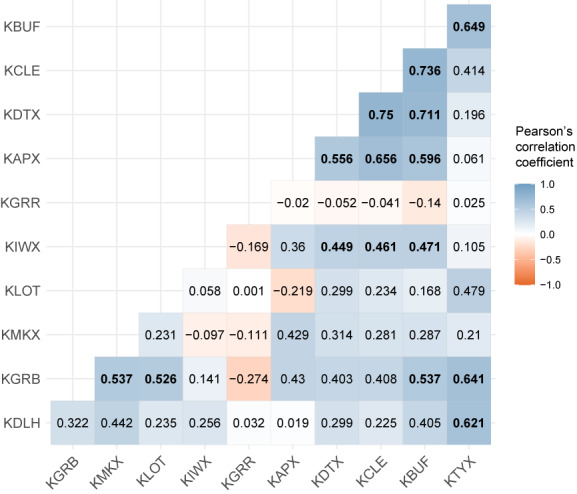
Pearson's correlation coefficient plot between yearly peak roosting activity dates at 11 radar stations. Colors indicate positive (blue) and negative (red) correlations. The value in each grid cell indicates the Pearson's correlation coefficient for the station pair. Significant correlations (p < .05) are denoted by bold font. Radar stations are sequenced in the order along the southern coastline of the Great Lakes (west to east).
3.2. Changes in phenology at three different spatial scales
At the regional scale, we found that across 21 years, swallows and martins formed pre‐migratory roosts in the Great Lakes region approximately 2.26 ± 2.23 days earlier per decade (coefficient ± 95% CI, p = .047) for peak roosting activity date (Figure 4). Similar advances were shown in the mean date metrics (coefficient ± 95% CI = −2.23 ± 2.00 days decade−1, p = .030), 75% passage date metrics (coefficient ± 95% CI = −3.10 ± 2.51 days decade−1, p = .018) and 90% passage date metrics (coefficient ± 95% CI = −4.09 ± 3.67 days decade−1, p = .031). However, we did not see significant trends for 10% and 25% dates. Our phenology trends were significantly different between this study and a previous study on nocturnal avian migration (Horton et al., 2020) across the Great Lakes region (Wilcoxon test for paired samples, p‐value <.05, V‐statistic = 9, n = 11). At the station scale, we found significant advancements in peak roosting activity dates in 3 out of 11 stations, with the rate of change varying between −8.2 to −4.5 days decade −1 (p < .05). At the local persistent roost scale, we did not find any significant phenological shifts for peak roosting activity date (n = 16).
FIGURE 4.
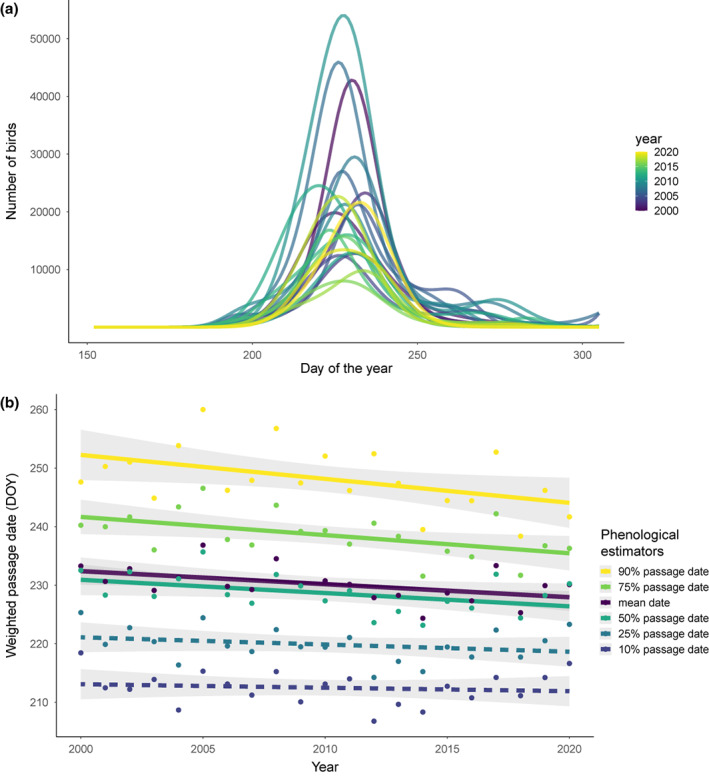
(a) Aerial insectivores' yearly roosting activity intensity (the number of birds) characterized at the Great Lakes region scale. The fitted lines are from a generalized additive model fit to the whole region for each year. (b) Regional weighted passage dates (90%, 75%, mean, 50%, 25%, 10%) versus year. Each point represents a regional passage date in 1 year using station‐level phenology estimates weighted by log‐transformed cumulative passage in each station. Fitted line and 95% confidence interval are derived from a linear regression for each phenological estimator. Solid lines represent significant (p < .05) regressions, and dotted lines represent non‐significant regressions (p ≥ .05).
3.3. Association between air temperature changes and phenological changes
Air temperature at 2 m above ground level during the active roosting months (July to September) increased over the past two decades at the Great Lakes region (estimate ±95% CI = 0.58 ± 0.18 °C decade−1; p‐value <.001) and warmed up significantly at 41.7% of the stations (5 out of 12 stations), varying between 0.67 and 0.80 °C decade−1 (p‐value <.05).
We compared phenology metrics to mean air temperature at station and regional scales, using the 10th, 25th, 50th, 75th, and 90th percentile passage dates, and mean date to capture all the phases of the roosting behavior. At region scale, regional daily mean temperature was not a significant predictor for any of the phenological estimators (10% passage date: slope = −0.010, p = .944; 25% passage date: slope = −0.108, p = .789; 50% passage date: slope = −0.501, p = .283; mean date: slope = −0.172, p = .692; 75% passage date: slope = −0.214, p = .737; 90% passage date: slope = 0.253, p = .765). At station scale, station daily mean temperature was also not predictive of roost phenology. Since we did not detect a significant phenology trend at the persistent roost scale, we did not explore the effect of air temperature on phenology at roost scale.
However, we found that temperature trends positively correlated with the trends in roosting phenology 75% passage dates (coefficient ± 95% CI = 0.030 ± 0.024, p‐value = .0197, F[9] = 8.015) and 90% passage dates (coefficient ± 95% CI = 0.022 ± 0.018, p‐value = .0208, F[9] = 7.826), but were not correlated with our other phenological estimators, for example 50% passage dates (p‐value = .267, F[9] = 1.399).
4. DISCUSSION
Migration and pre‐migratory roosts are essential periods in swallow and martin life histories, and using remote sensing, paired with new machine learning techniques, we show that this critical phenophase is shifting earlier throughout the past two decades. Specifically, our results indicate that their peak roosting phenology has advanced by 2.26 ± 2.23 days per decade (coefficient ± 95% CI) across the Great Lakes region. Air temperature trends in the same region during the active roosting period were predictive of later stages of roosting phenology trends (75% and 90% passage dates). There was also great within‐season synchrony of peak timing of roosting across the stations, which suggests phenology is paced by a region‐wide environmental cue not fully described by temperature alone. This study represents the first long‐term broad‐scale examination of aerial insectivore species' phenology during the non‐breeding season, and the first ecological application using roost detection by a deep‐learning approach at scale.
Our finding of advancing phenology is consistent with other large‐scale studies on migratory birds in North America and Europe. In a recent study on nocturnal avian migration using weather surveillance radar data, peak autumn migration timing advanced 0.52 ± 0.12 days decade−1 at the eastern flyway of contiguous United States (Horton et al., 2020). However, the magnitudes of advancement were significantly different between our measures from the Great Lakes region and those of Horton et al. (2020). Differences may not be surprising in this comparison, particularly because our measures exclusively characterize aerial insectivores, whereas the other study focused on measures from all nocturnal migrant species (likely hundreds of species). Give that we showed more rapid advancements, using similar technology, it may suggest that aerial insectivores display greater sensitivity to changes in aerial insect prey composition under climate change (Clark & Hobson, 2022; Twining et al., 2018, 2022). In addition, using citizen science data (i.e., eBird), Youngflesh et al. (2021) found that Tree Swallows, Barn Swallows, and Cliff Swallows arrived earlier in spring during periods with earlier vegetation green‐up, with the first two species having non‐zero overlapping 95% credible intervals. In another large‐scale phenological study in the UK, projected median shifts in phenology based on more than 10,000 terrestrial and aquatic phenological dataset over 20 years suggest that birds will advance their seasonal timing 2–4 days by the 2050s (Thackeray et al., 2016). Additionally, evidence from mist‐netting data on autumn avian migration in Europe (Haest et al., 2019; Tøttrup et al., 2006) showed interspecific variations in phenology trends, with species showing earlier departure (−1.8 days decade−1) and earlier mean autumn passage date (−0.01 to −1.86 days year−1). Apart from evidence on shifts in migration timing, the breeding phenology in various aerial insectivores is also shifting earlier. Cliff, Barn, and Tree Swallows in southeast Canada (New Brunswick and Nova Scotia) initiated clutches 8.1, 9.9, and 10.4 days earlier from 2006–2016 compared to 1962–1972, which is equivalent to 1.8, 2.2, and 2.3 days earlier decade−1 (Imlay et al., 2018). In another long‐term study, Tree Swallows have advanced their egg laying date 4.2 days decade−1 in southern Quebec, Canada (Bourret et al., 2015).
At the regional scale, we observed that 90% passage dates showed the strongest advances compared to weaker 75% passage date, and even weaker 50% passage date, potentially due to the pressure to avoid harsher environmental conditions in the latter part of the season, including cold snaps, depleting food resources, and low water availability (Horton et al., 2020; La Sorte et al., 2015; Xu & Si, 2019). Early parts of the season (10% and 25% passage date) did not show a significant trend, which could have resulted from non‐uniform arrivals composed of different age groups, individuals coming from different breeding grounds, different sexes, or individuals traveling at different rates (Neufeld et al., 2021). This suggests that climate change may be impacting aerial insectivore phenology unevenly across different periods of their roosting stage, potentially leading to a shortened pre‐migratory roosting season.
Climate change affects aerial insectivores differently depending on life history stage, and these differences may be due to diet diversity (Winkler et al., 2002). Specifically, during egg‐laying and chick‐rearing periods when food supply is most important, aerial insectivore species with diverse prey availability may be more resilient to mis‐timing and less affected by climate change. Purple martins have been shown to exploit a variety of food sources during their breeding season, including 56 prey species (79% ants and 1.5% dragonflies), as shown in a foraging study at Lake Texoma, Oklahoma (Helms et al., 2016). Adding to this, a 20‐year dataset has shown that Purple Martins lay eggs earlier in warmer springs and produce more fledglings (Shave et al., 2019). While the initiation of long‐distance migration is often regarded as less flexible, our study shows that swallows and martins do display phenotypic plasticity, and that this occurs after arrival to their breeding grounds. Their ability to adapt to seasonal variation, and by extension climate change, may apply to other periods of the non‐breeding season as evidenced by phenological response to temperature change across the Great Lakes region.
One limitation of this study is our inability to separate an apparent second wave of roosting emergence in late September and October from the main August emergence. The second wave here is defined as a roost emergence event that continues for a few days after the first wave has stopped for at least 5 days. Out of 12 radar stations examined, only some years in KGRB station (Green Bay, Wisconsin) and KIWX station (Fort Wayne, Indiana) had secondary waves after mid‐September. Without ground‐truth observations, we were not able to confirm the species identity of the second wave of roosting species. Late summer roosts in September could be a mixture of Purple Martins, Tree Swallows, and other swallow species (Burney, 2002; Kelly & Pletschet, 2018; Laughlin et al., 2013). We compared roost locations with previous studies (Bridge et al., 2016; Kelly & Pletschet, 2018) and plotted the known swallow roost species identity (Figure S4). Out of 104 roost clusters, 33 roost clusters (39.80% of the number of birds quantified by radar) in our paper overlapped with roost locations documented in previous literature and are considered as known species ID roosts. Out of 33 known roosts, 30 roost clusters were Purple Martin roosts (89.83% of the number of known ID birds) and 3 roost clusters belonged to a mix of Tree Swallows and Bank Swallows (10.17% of the number of known ID birds). While we cannot ascertain species identities of all roosts used in this study, evidence suggests that Purple Martins are the dominant signal in this study, with a lesser contribution from Tree Swallows and Bank Swallows. Future research at a contiguous United States spatial scale needs to be cautious about swallow species separation.
This study provides the first quantification of the phenological trend in aerial insectivore roosting behavior and explores potential associations of phenology change with air temperature, by leveraging increasing accessibility of long‐term weather surveillance radar data and advanced machine learning methods applicable to aeroecology studies. Discovering mechanisms behind phenological change remains a priority for aerial insectivore conservation, and future research that explores long‐term phenology records of various species of prey in relation to insectivore phenology at different scales is still urgently needed. Our study shows phenotypic plasticity in these long‐distance hemispheric migrants at different spatial scales, providing insights into the ability of aerial insectivores to respond to global change. It provides a stepping stone for understanding the impact of climate change on this group of rapidly declining species and for examining the phenology mismatch in trophic interactions at even broad spatial scales in future studies.
AUTHOR CONTRIBUTIONS
Yuting Deng, Maria Carolina T. D. Belotti, and Kyle G. Horton worked to conceive and design this study. Yuting Deng drafted the manuscript, generated figures, and conducted statistical analyses. Wenlong Zhao, Zezhou Cheng, Gustavo Perez, Subhransu Maji, and Daniel R. Sheldon developed and deployed roost detection algorithm. Maria Carolina T. D. Belotti processed the radar data. Yuting Deng, Maria Carolina T. D. Belotti, and Victoria F. Simons screened radar data. All coauthors provided edits and approved this draft of the manuscript.
CONFLICT OF INTEREST
The authors declare no conflict of interest.
Supporting information
Figures S1‐S4
ACKNOWLEDGMENTS
This project was supported by NSF Collaborative Research: MRA: Insectivore Response to Environmental Change (CSU: 2017554, UMass: 2017756, OU: 2017582). We thank Dr. Larissa Bailey, Dr. Kristen Ruegg, and Dr. William Kendall for their comments on the first version of this manuscript. We are also very grateful to two anonymous reviewers for their extremely constructive comments.
Deng, Y. , Belotti, M. C. T. D. , Zhao, W. , Cheng, Z. , Perez, G. , Tielens, E. , Simons, V. F. , Sheldon, D. R. , Maji, S. , Kelly, J. F. , & Horton, K. G. (2023). Quantifying long‐term phenological patterns of aerial insectivores roosting in the Great Lakes region using weather surveillance radar. Global Change Biology, 29, 1407–1419. 10.1111/gcb.16509
DATA AVAILABILITY STATEMENT
The data that support the findings of this study are openly available in Figshare at https://figshare.com/s/8ded3e936537f11990fe, reference number 10.6084/m9.figshare.20137961.
REFERENCES
- Aikens, E. O. , Dwinnell, S. P. H. , LaSharr, T. N. , Jakopak, R. P. , Fralick, G. L. , Randall, J. , Kaiser, R. , Thonhoff, M. , Kauffman, M. J. , & Monteith, K. L. (2021). Migration distance and maternal resource allocation determine timing of birth in a large herbivore. Ecology, 102(6), e03334. 10.1002/ecy.3334 [DOI] [PMC free article] [PubMed] [Google Scholar]
- Belotti, M. C. T. D. , Deng, Y. , Zhao, W. , Simmons, V. F. , Cheng, Z. , Perez, G. , Tielens, E. , Maji, S. , Sheldon, D. , Kelly, J. F. , & Horton, K. G. (in review). Long‐term analysis of persistence and size of swallow and martin roosts in the US Great Lakes.
- Bent, A. C. (1942). Life histories of north American flycatchers, larks, swallows, and their allies. Order Passeriformes (families Cotingidae, Tyrannidae, Alaudidae, and Hirundinidae). Bulletin of the United States National Museum, 179, 489–509. 10.5479/si.03629236.179.i [DOI] [Google Scholar]
- Bigger, D. , Peery, M. Z. , Chinnici, S. , & Courtney, S. P. (2006). Efficacy of audiovisual and radar surveys for studying marbled murrelets in inland habitats. Journal of Wildlife Management, 70(2), 505–516. 10.2193/0022-541x(2006)70[505:eoaars]2.0.co;2 [DOI] [Google Scholar]
- Bonter, D. N. , Gauthreaux, S. A., Jr. , & Donovan, T. M. (2009). Characteristics of important stopover locations for migrating birds: Remote sensing with radar in the great lakes basin. Conservation Biology, 23(2), 440–448. 10.1111/j.1523-1739.2008.01085.x [DOI] [PubMed] [Google Scholar]
- Bourret, A. , Bélisle, M. , Pelletier, F. , & Garant, D. (2015). Multidimensional environmental influences on timing of breeding in a tree swallow population facing climate change. Evolutionary Applications, 8(10), 933–944. 10.1111/eva.12315 [DOI] [PMC free article] [PubMed] [Google Scholar]
- Bridge, E. S. , Pletschet, S. M. , Fagin, T. , Chilson, P. B. , Horton, K. G. , Broadfoot, K. R. , & Kelly, J. F. (2016). Persistence and habitat associations of purple Martin roosts quantified via weather surveillance radar. Landscape Ecology, 31(1), 43–53. 10.1007/s10980-015-0279-0 [DOI] [Google Scholar]
- Brown, C. R. , Airola, D. A. , & Tarof, S. (2021). Purple Martin (Progne subis), version 2.0. In Rodewald P. G. (Ed.), Birds of the world. Cornell Lab of Ornithology. [Google Scholar]
- Burney, C. W. (2002). A study of swallow roosts found in the eastern United States [Master's Thesis]. Cornell University. [Google Scholar]
- Cabrera‐Cruz, S. A. , Cohen, E. B. , Smolinsky, J. A. , & Buler, J. J. (2020). Artificial light at night is related to broad‐scale stopover distributions of nocturnally migrating landbirds along the Yucatan peninsula, Mexico. Remote Sensing, 12(3), 395. 10.3390/rs12030395 [DOI] [Google Scholar]
- Cheng, Z. , Gabriel, S. , Bhambhani, P. , Sheldon, D. , Maji, S. , Laughlin, A. , & Winkler, D. (2020). Detecting and tracking communal bird roosts in weather radar data. Proceedings of the AAAI Conference on Artificial Intelligence, 34(1), 378–385. http://arxiv.org/abs/2004.12819 [Google Scholar]
- Chilson, C. , Avery, K. , McGovern, A. , Bridge, E. , Sheldon, D. , & Kelly, J. (2019). Automated detection of bird roosts using NEXRAD radar data and convolutional neural networks. Remote Sensing in Ecology and Conservation, 5(1), 20–32. 10.1002/rse2.92 [DOI] [Google Scholar]
- Chilson, P. B. , Frick, W. F. , Stepanian, P. M. , Shipley, J. R. , Kunz, T. H. , & Kelly, J. F. (2012). Estimating animal densities in the aerosphere using weather radar: To Z or not to Z? Ecosphere, 3(8), 1–19. 10.1890/es12-00027.1 [DOI] [Google Scholar]
- Clark, R. , & Hobson, K. (2022). Climate change: Aerial insectivores struggle to keep pace with earlier pulses of nutritious aquatic foods. Current Biology, 32(6), R267–R269. 10.1016/J.CUB.2022.01.076 [DOI] [PubMed] [Google Scholar]
- Cleland, E. E. , Chuine, I. , Menzel, A. , Mooney, H. A. , & Schwartz, M. D. (2007). Shifting plant phenology in response to global change. Trends in Ecology & Evolution, 22(7), 357–365. 10.1016/j.tree.2007.04.003 [DOI] [PubMed] [Google Scholar]
- Conrad, K. F. , Warren, M. S. , Fox, R. , Parsons, M. S. , & Woiwod, I. P. (2006). Rapid declines of common, widespread British moths provide evidence of an insect biodiversity crisis. Biological Conservation, 132(3), 279–291. 10.1016/j.biocon.2006.04.020 [DOI] [Google Scholar]
- Diehl, R. H. , Larkin, R. P. , & Black, J. E. (2003). Radar observations of bird migration over the Great Lakes. The Auk, 120(2), 278–290. 10.2307/4090180 [DOI] [Google Scholar]
- Diez, J. M. , Ibáñez, I. , Miller‐Rushing, A. J. , Mazer, S. J. , Crimmins, T. M. , Crimmins, M. A. , Bertelsen, C. D. , & Inouye, D. W. (2012). Forecasting phenology: From species variability to community patterns. Ecology Letters, 15(6), 545–553. 10.1111/j.1461-0248.2012.01765.x [DOI] [PubMed] [Google Scholar]
- Dokter, A. M. , Farnsworth, A. , Fink, D. , Ruiz‐Gutierrez, V. , Hochachka, W. M. , la Sorte, F. A. , Robinson, O. J. , Rosenberg, K. V. , & Kelling, S. (2018). Seasonal abundance and survival of North America's migratory avifauna determined by weather radar. Nature Ecology & Evolution, 2(10), 1603–1609. 10.1038/s41559-018-0666-4 [DOI] [PubMed] [Google Scholar]
- Dokter, A. M. , Liechti, F. , Stark, H. , Delobbe, L. , Tabary, P. , & Holleman, I. (2011). Bird migration flight altitudes studied by a network of operational weather radars. Journal of the Royal Society Interface, 8(54), 30–43. 10.1098/rsif.2010.0116 [DOI] [PMC free article] [PubMed] [Google Scholar]
- Dunn, P. O. , & Winkler, D. W. (1999). Climate change has affected the breeding date of tree swallows throughout North America. Proceedings of the Royal Society B: Biological Sciences, 266(1437), 2487–2490. 10.1098/RSPB.1999.0950 [DOI] [PMC free article] [PubMed] [Google Scholar]
- Dunning, J. B. (2007). CRC handbook of avian body masses. CRC Press. [Google Scholar]
- Everall, N. C. , Johnson, M. F. , Wilby, R. L. , & Bennett, C. J. (2015). Detecting phenology change in the mayfly Ephemera danica: Responses to spatial and temporal water temperature variations. Ecological Entomology, 40(2), 95–105. 10.1111/een.12164 [DOI] [Google Scholar]
- Gallinat, A. S. , Primack, R. B. , & Wagner, D. L. (2015). Autumn, the neglected season in climate change research. Trends in Ecology & Evolution, 30(3), 169–176. 10.1016/j.tree.2015.01.004 [DOI] [PubMed] [Google Scholar]
- Gauthreaux, S. A. , & Belser, C. G. (1998). Displays of bird movements on the WSR‐88D: Patterns and quantification. Weather and Forecasting, 13(2), 453–464. [DOI] [Google Scholar]
- Gittings, J. A. , Raitsos, D. E. , Kheireddine, M. , Racault, M. F. , Claustre, H. , & Hoteit, I. (2019). Evaluating tropical phytoplankton phenology metrics using contemporary tools. Scientific Reports, 9(1), 1–9. 10.1038/s41598-018-37370-4 [DOI] [PMC free article] [PubMed] [Google Scholar]
- Haest, B. , Hüppop, O. , van de Pol, M. , & Bairlein, F. (2019). Autumn bird migration phenology: A potpourri of wind, precipitation and temperature effects. Global Change Biology, 25(12), 4064–4080. 10.1111/gcb.14746 [DOI] [PubMed] [Google Scholar]
- Haest, B. , Stepanian, P. M. , Wainwright, C. E. , Liechti, F. , & Bauer, S. (2021). Climatic drivers of (changes in) bat migration phenology at bracken cave (USA). Global Change Biology, 27(4), 768–780. 10.1111/gcb.15433 [DOI] [PubMed] [Google Scholar]
- Helm, B. , Van Doren, B. M. , Hoffmann, D. , & Hoffmann, U. (2019). Evolutionary response to climate change in migratory pied flycatchers. Current Biology, 29(21), 3714–3719. 10.1016/j.cub.2019.08.072 [DOI] [PubMed] [Google Scholar]
- Helms, J. A. , Godfrey, A. P. , Ames, T. , & Bridge, E. S. (2016). Predator foraging altitudes reveal the structure of aerial insect communities. Scientific Reports, 6(1), 1–10. 10.1038/srep28670 [DOI] [PMC free article] [PubMed] [Google Scholar]
- Herkert, J. R. (1994). The effects of habitat fragmentation on midwestern grassland bird communities. Ecological Applications, 4(3), 461–471. 10.2307/1941950 [DOI] [Google Scholar]
- Hoen, B. D. , Diffendorfer, J. E. , Rand, J. T. , Kramer, L. A. , Garrity, C. P. , & Hunt, H. E. (2018). United States wind turbine database (v4.3, January 14, 2022). U.S. Geological Survey, American Clean Power Association, and Lawrence Berkeley National Laboratory data release. 10.5066/F7TX3DN0 [DOI] [Google Scholar]
- Holmes, R. T. , & Sherry, T. W. (2001). Thirty‐year bird population trends in an unfragmented temperate deciduous forest: Importance of habitat change. Auk, 118(3), 589–609. 10.2307/4089923 [DOI] [Google Scholar]
- Horn, J. W. , & Kunz, T. H. (2008). Analyzing NEXRAD doppler radar images to assess nightly dispersal patterns and population trends in Brazilian free‐tailed bats (Tadarida brasiliensis). Integrative and Comparative Biology, 48(1), 24–39. 10.1093/icb/icn051 [DOI] [PubMed] [Google Scholar]
- Horton, K. G. , Gregory Shriver, W. , & Buler, J. J. (2015). An assessment of spatio‐temporal relationships between nocturnal bird migration traffic rates and diurnal bird stopover density. Movement Ecology, 4(1), 1–10. 10.1186/s40462-015-0066-1 [DOI] [PMC free article] [PubMed] [Google Scholar]
- Horton, K. G. , la Sorte, F. A. , Sheldon, D. , Lin, T. Y. , Winner, K. , Bernstein, G. , Maji, S. , Hochachka, W. M. , & Farnsworth, A. (2020). Phenology of nocturnal avian migration has shifted at the continental scale. Nature Climate Change, 10(1), 63–68. 10.1038/s41558-019-0648-9 [DOI] [Google Scholar]
- Horton, K. G. , Nilsson, C. , Van Doren, B. M. , la Sorte, F. A. , Dokter, A. M. , & Farnsworth, A. (2019). Bright lights in the big cities: Migratory birds' exposure to artificial light. Frontiers in Ecology and the Environment, 17(4), 209–214. 10.1002/fee.2029 [DOI] [Google Scholar]
- Horton, K. G. , Van Doren, B. M. , la Sorte, F. A. , Cohen, E. B. , Clipp, H. L. , Buler, J. J. , Fink, D. , Kelly, J. F. , & Farnsworth, A. (2019). Holding steady: Little change in intensity or timing of bird migration over the Gulf of Mexico. Global Change Biology, 25(3), 1106–1118. 10.1111/gcb.14540 [DOI] [PubMed] [Google Scholar]
- Imlay, T. L. , Mills Flemming, J. , Saldanha, S. , Wheelwright, N. T. , & Leonard, M. L. (2018). Breeding phenology and performance for four swallows over 57 years: Relationships with temperature and precipitation. Ecosphere, 9(4), e02166. 10.1002/ecs2.2166 [DOI] [Google Scholar]
- Imlay, T. L. , & Taylor, P. D. (2020). Diurnal and crepuscular activity during fall migration for four species of aerial foragers. Wilson Journal of Ornithology, 132(1), 159–164. 10.1676/1559-4491-132.1.159 [DOI] [Google Scholar]
- Inouye, D. W. (2022). Climate change and phenology. Wiley Interdisciplinary Reviews: Climate Change, 13(3), e764. 10.1002/wcc.764 [DOI] [PMC free article] [PubMed] [Google Scholar]
- Kelly, J. F. , & Pletschet, S. M. (2018). Accuracy of swallow roost locations assigned using weather surveillance radar. Remote Sensing in Ecology and Conservation, 4(2), 166–172. 10.1002/rse2.66 [DOI] [Google Scholar]
- Kelly, J. F. , Shipley, J. R. , Chilson, P. B. , Howard, K. W. , Frick, W. F. , & Kunz, T. H. (2012). Quantifying animal phenology in the aerosphere at a continental scale using NEXRAD weather radars. Ecosphere, 3(2), 1–9. 10.1890/ES11-00257.1 [DOI] [Google Scholar]
- Kerby, J. , & Post, E. (2013). Reproductive phenology of large mammals. In Phenology: An integrative environmental science (pp. 467–479). Springer, Dordrecht. 10.1007/978-94-007-6925-0_25 [DOI] [Google Scholar]
- Kirby, R. E. (1978). Roosting of passerines over open water at night. North American Bird Bander, 3(3). https://www.osti.gov/biblio/5238773 [Google Scholar]
- La Sorte, F. A. , Hochachka, W. M. , Farnsworth, A. , Sheldon, D. , Fink, D. , Geevarghese, J. , Winner, K. , Van Doren, B. M. , & Kelling, S. (2015). Migration timing and its determinants for nocturnal migratory birds during autumn migration. Journal of Animal Ecology, 84(5), 1202–1212. 10.1111/1365-2656.12376 [DOI] [PubMed] [Google Scholar]
- Lafleur, J. M. , Buler, J. J. , & Moore, F. R. (2016). Geographic position and landscape composition explain regional patterns of migrating landbird distributions during spring stopover along the northern coast of the Gulf of Mexico. Landscape Ecology, 31(8), 1697–1709. 10.1007/s10980-016-0354-1 [DOI] [Google Scholar]
- Laughlin, A. J. , Sheldon, D. R. , Winkler, D. W. , & Taylor, C. M. (2014). Behavioral drivers of communal roosting in a songbird: A combined theoretical and empirical approach. Behavioral Ecology, 25(4), 734–743. 10.1093/beheco/aru044 [DOI] [Google Scholar]
- Laughlin, A. J. , Sheldon, D. R. , Winkler, D. W. , & Taylor, C. M. (2016). Quantifying non‐breeding season occupancy patterns and the timing and drivers of autumn migration for a migratory songbird using Doppler radar. Ecography, 39(10), 1017–1024. 10.1111/ecog.01988 [DOI] [Google Scholar]
- Laughlin, A. J. , Taylor, C. M. , Bradley, D. W. , LeClair, D. , Clark, R. G. , Dawson, R. D. , Dunn, P. O. , Horn, A. , Leonard, M. , Sheldon, D. R. , Shutler, D. , Whittingham, L. A. , Winkler, D. W. , & Norris, D. R. (2013). Integrating information from geolocators, weather radar, and citizen science to uncover a key stopover area of an aerial insectivore. Auk, 130(2), 230–239. 10.1525/auk.2013.12229 [DOI] [Google Scholar]
- McLaren, J. D. , Buler, J. J. , Schreckengost, T. , Smolinsky, J. A. , Boone, M. , Emiel van Loon, E. , Dawson, D. K. , & Walters, E. L. (2018). Artificial light at night confounds broad‐scale habitat use by migrating birds. Ecology Letters, 21(3), 356–364. 10.1111/ele.12902 [DOI] [PubMed] [Google Scholar]
- Menzel, A. , Sparks, T. H. , Estrella, N. , Koch, E. , Aaasa, A. , Ahas, R. , Alm‐Kübler, K. , Bissolli, P. , Braslavská, O. , Briede, A. , Chmielewski, F. M. , Crepinsek, Z. , Curnel, Y. , Dahl, Å. , Defila, C. , Donnelly, A. , Filella, Y. , Jatczak, K. , Måge, F. , … Zust, A. (2006). European phenological response to climate change matches the warming pattern. Global Change Biology, 12(10), 1969–1976. 10.1111/j.1365-2486.2006.01193.x [DOI] [Google Scholar]
- Miller‐Rushing, A. J. , Høye, T. T. , Inouye, D. W. , & Post, E. (2010). The effects of phenological mismatches on demography. Philosophical Transactions of the Royal Society B: Biological Sciences, 365(1555), 3177–3186. 10.1098/rstb.2010.0148 [DOI] [PMC free article] [PubMed] [Google Scholar]
- Moussus, J.‐P. , Julliard, R. , & Jiguet, F. (2010). Featuring 10 phenological estimators using simulated data. Methods in Ecology and Evolution, 1(2), 140–150. 10.1111/J.2041-210X.2010.00020.X [DOI] [Google Scholar]
- Nebuloni, R. , Capsoni, C. , & Vigorita, V. (2008). Quantifying bird migration by a high‐resolution weather radar. IEEE Transactions on Geoscience and Remote Sensing, 46(6), 1867–1875. 10.1109/TGRS.2008.916467 [DOI] [Google Scholar]
- Neufeld, L. R. , Muthukumarana, S. , Fischer, J. D. , Ray, J. D. , Siegrist, J. , & Fraser, K. C. (2021). Breeding latitude is associated with the timing of nesting and migration around the annual calendar among purple Martin (Progne subis) populations. Journal of Ornithology, 162(4), 1009–1024. 10.1007/s10336-021-01894-w [DOI] [Google Scholar]
- Nilsson, C. , Dokter, A. M. , Verlinden, L. , Shamoun‐Baranes, J. , Schmid, B. , Desmet, P. , Bauer, S. , Chapman, J. , Alves, J. A. , Stepanian, P. M. , Sapir, N. , Wainwright, C. , Boos, M. , Górska, A. , Menz, M. H. M. , Rodrigues, P. , Leijnse, H. , Zehtindjiev, P. , Brabant, R. , … Liechti, F. (2019). Revealing patterns of nocturnal migration using the European weather radar network. Ecography, 42(5), 876–886. 10.1111/ecog.04003 [DOI] [Google Scholar]
- Panchen, Z. A. , Primack, R. B. , Gallinat, A. S. , Nordt, B. , Stevens, A. D. , Du, Y. , & Fahey, R. (2015). Substantial variation in leaf senescence times among 1360 temperate woody plant species: Implications for phenology and ecosystem processes. Annals of Botany, 116(6), 865–873. 10.1093/aob/mcv015 [DOI] [PMC free article] [PubMed] [Google Scholar]
- Pedregosa, F. , Varoquaux, G. , Gramfort, A. , Michel, V. , Thirion, B. , Grisel, O. , Blondel, M. , Prettenhofer, P. , Weiss, R. , Dubourg, V. , Vanderplas, J. , Passos, A. , Cournapeau, D. , Brucher, M. , Perrot, M. , & Duchesnay, E. (2011). Scikit‐learn: Machine learning in python. Journal of Machine Learning Research, 12, 2825–2830. [Google Scholar]
- Post, E. , & Forchhammer, M. C. (2008). Climate change reduces reproductive success of an Arctic herbivore through trophic mismatch. Philosophical Transactions of the Royal Society B: Biological Sciences, 363(1501), 2367–2373. 10.1098/rstb.2007.2207 [DOI] [PMC free article] [PubMed] [Google Scholar]
- Ren, S. , He, K. , Girshick, R. , & Sun, J. (2017). Faster R‐CNN: Towards real‐time object detection with region proposal networks. IEEE Transactions on Pattern Analysis and Machine Intelligence, 39(6), 1137–1149. 10.1109/TPAMI.2016.2577031 [DOI] [PubMed] [Google Scholar]
- Rioux Paquette, S. , Pelletier, F. , Garant, D. , & Bélisle, M. (2014). Severe recent decrease of adult body mass in a declining insectivorous bird population. Proceedings of the Royal Society B: Biological Sciences, 281(1786), 20140649. 10.1098/rspb.2014.0649 [DOI] [PMC free article] [PubMed] [Google Scholar]
- Rosenberg, K. v., Dokter, A. M. , Blancher, P. J. , Sauer, J. R. , Smith, A. C. , Smith, P. A. , Stanton, J. C. , Panjabi, A. , Helft, L. , Parr, M. , & Marra, P. P. (2019). Decline of the north American avifauna. Science, 366(6461), 120–124. 10.1126/science.aaw1313 [DOI] [PubMed] [Google Scholar]
- Russakovsky, O. , Deng, J. , Su, H. , Krause, J. , Satheesh, S. , Ma, S. , Huang, Z. , Karpathy, A. , Khosla, A. , Bernstein, M. , Berg, A. C. , & Fei‐Fei, L. (2015). ImageNet large scale visual recognition challenge. International Journal of Computer Vision, 115(3), 211–252. 10.1007/s11263-015-0816-y [DOI] [Google Scholar]
- Russell, K. R. , & Gauthreaux, S. A. (1998). Use of weather radar to characterize movements of roosting purple martins. Wildlife Society Bulletin, 26(1), 5–16. https://about.jstor.org/terms [Google Scholar]
- Russell, K. R. , & Gauthreaux, S. A. (1999). Spatial and temporal dynamics of a purple Martin pre‐migratory roost. The Wilson Bulletin, 111(3), 354–362. https://about.jstor.org/terms [Google Scholar]
- Saldanha, S. , Taylor, P. D. , Imlay, T. L. , & Leonard, M. L. (2019). Biological and environmental factors related to communal roosting behavior of breeding bank swallow (Riparia riparia). Avian Conservation and Ecology, 14(2), 21. 10.5751/ACE-01490-140221 [DOI] [Google Scholar]
- Schwartz, M. D. (2013). Phenology: An integrative environmental science. Kluwer Academic Publishers. [Google Scholar]
- Shave, A. , Garroway, C. J. , Siegrist, J. , & Fraser, K. C. (2019). Timing to temperature: Egg‐laying dates respond to temperature and are under stronger selection at northern latitudes. Ecosphere, 10(12), e02974. 10.1002/ecs2.2974 [DOI] [Google Scholar]
- Shutler, D. , Hussell, D. J. T. , Norris, D. R. , Winkler, D. W. , Robertson, R. J. , Bonier, F. , Rendell, W. B. , Bélisle, M. , Clark, R. G. , Dawson, R. D. , Wheelwright, N. T. , Lombardo, M. P. , Thorpe, P. A. , Truan, M. A. , Walsh, R. , Leonard, M. L. , Horn, A. G. , Vleck, C. M. , Vleck, D. , … Stanback, M. T. (2012). Spatiotemporal patterns in nest box occupancy by tree swallows across North America. Avian Conservation and Ecology, 7(1), 3. 10.5751/ace-00517-070103 [DOI] [Google Scholar]
- Spiller, K. J. , & Dettmers, R. (2019). Evidence for multiple drivers of aerial insectivore declines in North America. Condor, 121(2), duz010. 10.1093/condor/duz010 [DOI] [Google Scholar]
- Stepanian, P. M. , Entrekin, S. A. , Wainwright, C. E. , Mirkovic, D. , Tank, J. L. , Kelly, J. F. , & Schindler, D. W. (2020). Declines in an abundant aquatic insect, the burrowing mayfly, across major north American waterways. Proceedings of the National Academy of Sciences of the United States of America, 117(6), 2987–2992. 10.1073/pnas.1913598117/-/DCSupplemental.y [DOI] [PMC free article] [PubMed] [Google Scholar]
- Stepanian, P. M. , Horton, K. G. , Melnikov, V. M. , Zrnić, D. S. , & Gauthreaux, S. A. (2016). Dual‐polarization radar products for biological applications. Ecosphere, 7(11), e01539. 10.1002/ecs2.1539 [DOI] [Google Scholar]
- Stepanian, P. M. , & Wainwright, C. E. (2018). Ongoing changes in migration phenology and winter residency at bracken bat cave. Global Change Biology, 24(7), 3266–3275. 10.1111/gcb.14051 [DOI] [PubMed] [Google Scholar]
- Thackeray, S. J. , Henrys, P. A. , Hemming, D. , Bell, J. R. , Botham, M. S. , Burthe, S. , Helaouet, P. , Johns, D. G. , Jones, I. D. , Leech, D. I. , MacKay, E. B. , Massimino, D. , Atkinson, S. , Bacon, P. J. , Brereton, T. M. , Carvalho, L. , Clutton‐Brock, T. H. , Duck, C. , Edwards, M. , … Wanless, S. (2016). Phenological sensitivity to climate across taxa and trophic levels. Nature, 535(7611), 241–245. 10.1038/NATURE18608 [DOI] [PubMed] [Google Scholar]
- Torres, S. M. (2007). Initial implementation of super‐resolution data on the NEXRAD network. American Meteorological Society Annual Meeting, San Antonio, Texas. https://ams.confex.com/ams/87ANNUAL/techprogram/paper_116240.htm
- Tøttrup, A. P. , Thorup, K. , & Rahbek, C. (2006). Changes in timing of autumn migration in north European songbird populations. Ardea, 94(3), 527. [Google Scholar]
- Tryjanowski, P. , Kuzniak, S. , & Sparks, T. (2002). Earlier arrival of some farmland migrants in western Poland. Ibis, 144(1), 62–68. 10.1046/j.0019-1019.2001.00022.x [DOI] [Google Scholar]
- Twining, C. W. , Shipley, J. R. , & Matthews, B. (2022). Climate change creates nutritional phenological mismatches. Trends in Ecology & Evolution, 37(9), 736–739. 10.1016/J.TREE.2022.06.009 [DOI] [PubMed] [Google Scholar]
- Twining, C. W. , Shipley, J. R. , & Winkler, D. W. (2018). Aquatic insects rich in omega‐3 fatty acids drive breeding success in a widespread bird. Ecology Letters, 21(12), 1812–1820. 10.1111/ELE.13156 [DOI] [PubMed] [Google Scholar]
- Van Doren, B. M. , Horton, K. G. , Dokter, A. M. , Klinck, H. , Elbin, S. B. , & Farnsworth, A. (2017). High‐intensity urban light installation dramatically alters nocturnal bird migration. Proceedings of the National Academy of Sciences of the United States of America, 114(42), 11175–11180. 10.1073/pnas.1708574114 [DOI] [PMC free article] [PubMed] [Google Scholar]
- Van Doren, B. M. , Willard, D. E. , Hennen, M. , Horton, K. G. , Stuber, E. F. , Sheldon, D. , Sivakumar, A. H. , Wang, J. , Farnsworth, A. , & Winger, B. M. (2021). Drivers of fatal bird collisions in an urban center. Proceedings of the National Academy of Sciences of the United States of America, 118(24), e2101666118. 10.1073/pnas.2101666118/-/DCSupplemental.y [DOI] [PMC free article] [PubMed] [Google Scholar]
- Westbrook, J. K. , Eyster, R. S. , & Wolf, W. W. (2014). WSR‐88D doppler radar detection of corn earworm moth migration. International Journal of Biometeorology, 58(5), 931–940. 10.1007/s00484-013-0676-5 [DOI] [PubMed] [Google Scholar]
- Wood, S. N. (2011). Fast stable restricted maximum likelihood and marginal likelihood estimation of semiparametric generalized linear models. Journal of the Royal Statistical Society (B), 73(1), 3–36. 10.1111/j.1467-9868.2010.00749.x [DOI] [Google Scholar]
- Winkler, D. W. , Dunn, P. O. , & McCulloch, C. E. (2002). Predicting the effects of climate change on avian life‐history traits. Proceedings of the National Academy of Sciences of the United States of America, 99(21), 13595–13599. 10.1073/pnas.212251999 [DOI] [PMC free article] [PubMed] [Google Scholar]
- Xu, F. , & Si, Y. (2019). The frost wave hypothesis: How the environment drives autumn departure of migratory waterfowl. Ecological Indicators, 101, 1018–1025. 10.1016/j.ecolind.2019.02.024 [DOI] [Google Scholar]
- Youngflesh, C. , Socolar, J. , Amaral, B. R. , Arab, A. , Guralnick, R. P. , Hurlbert, A. H. , LaFrance, R. , Mayor, S. J. , Miller, D. A. W. , & Tingley, M. W. (2021). Migratory strategy drives species‐level variation in bird sensitivity to vegetation green‐up. Nature Ecology and Evolution, 5(7), 987–994. 10.1038/s41559-021-01442-y [DOI] [PubMed] [Google Scholar]
Associated Data
This section collects any data citations, data availability statements, or supplementary materials included in this article.
Supplementary Materials
Figures S1‐S4
Data Availability Statement
The data that support the findings of this study are openly available in Figshare at https://figshare.com/s/8ded3e936537f11990fe, reference number 10.6084/m9.figshare.20137961.