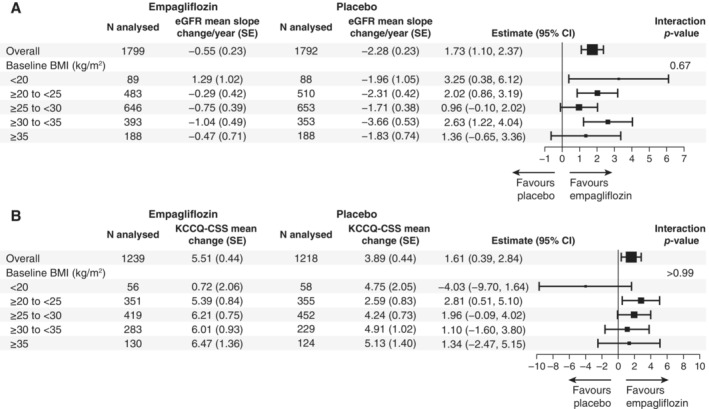
Figure 4.

Treatment effect on estimated glomerular filtration rate (eGFR) slope (A) and Kansas City Cardiomyopathy Questionnaire clinical summary score (KCCQ‐CSS) (B) according to baseline body mass index (BMI) categories. Forest plot summarizing the treatment effects on eGFR slope estimates and difference in change in KCCQ‐CSS from baseline to week 52 across BMI categories. Between‐group difference in the slope of change during the treatment period in eGFR were analysed using a random intercept random model in the treated set. The model includes age, baseline eGFR, region, baseline diabetes status, sex, baseline left ventricular ejection fraction, treatment, baseline BMI categories, and treatment by baseline BMI categories interaction. CI, confidence interval; SE, standard error.
