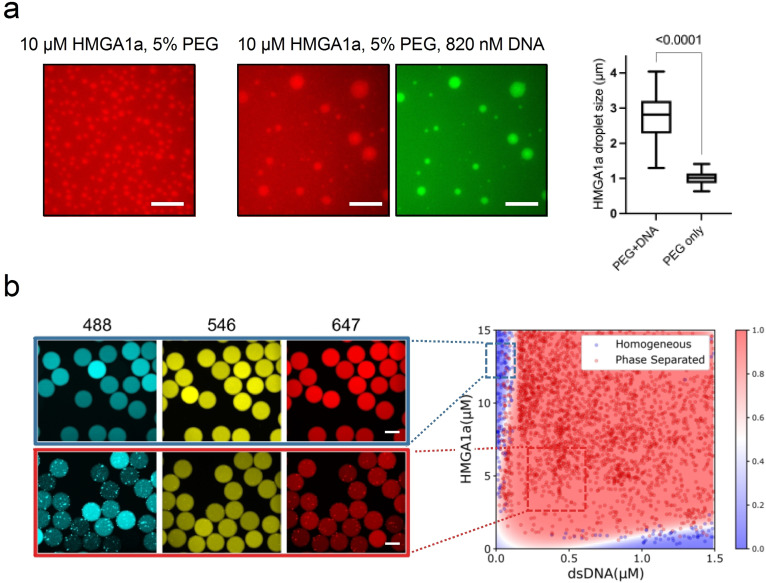
Figure 3.
HMGA1a undergoes LLPS in vitro in the presence of crowder and DNA. (a) HMGA1a at 10 μM (labelled with Alexa 647, red) readily undergoes LLPS with 5 % PEG (20k) (left panel) and 820 nM DNA (24 bp duplex, labelled with Atto488, green) present (centre panel). The comparison of HMGA1a condensate size with or without addition of DNA (right panel). Buffer: 50 mM Tris‐HCl, 150 mM KCl. Scale bars, 10 μm. In the box plots, boxes extend from the 25th to 75th percentiles, with a line at the median. Whiskers span 1.5× the interquartile range. Statistical analysis was performed using a two‐sided t‐test (p‐value <0.0001). (b) Left panel: Epifluorescence microscopy images of microdroplets with Alexa 488 (blue), Alexa 546 (yellow), and Alexa 647 (red) fluorescence corresponding to DNA (24 bp duplex, labelled with Atto488), PEG, and HMGA1a (labelled with Alexa 647), respectively. Scale bars, 100 μm. Buffer: 50 mM Tris‐HCl (pH 7.4), 120 mM KCl. PEG (20k) concentration was 3 % (w/v). Right panel: Phase diagram of HMGA1a in the presence of DNA generated through PhaseScan droplet microfluidics. Red, phase separated, Blue, mixed. Phase diagram was generated from N=6296. Colour bar: Probability of a region in the chemical space being phase separated classified and predicted using machine learning.

