FIGURE 4.

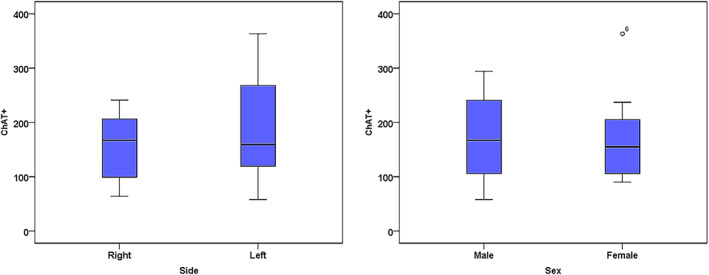
Box plot diagram of ChAT+ fibers by side and sex. The number of ChAT+ fibers was more variable on the left side than the right, and more variable in males than females, but these differences were not statistically significant.

Box plot diagram of ChAT+ fibers by side and sex. The number of ChAT+ fibers was more variable on the left side than the right, and more variable in males than females, but these differences were not statistically significant.