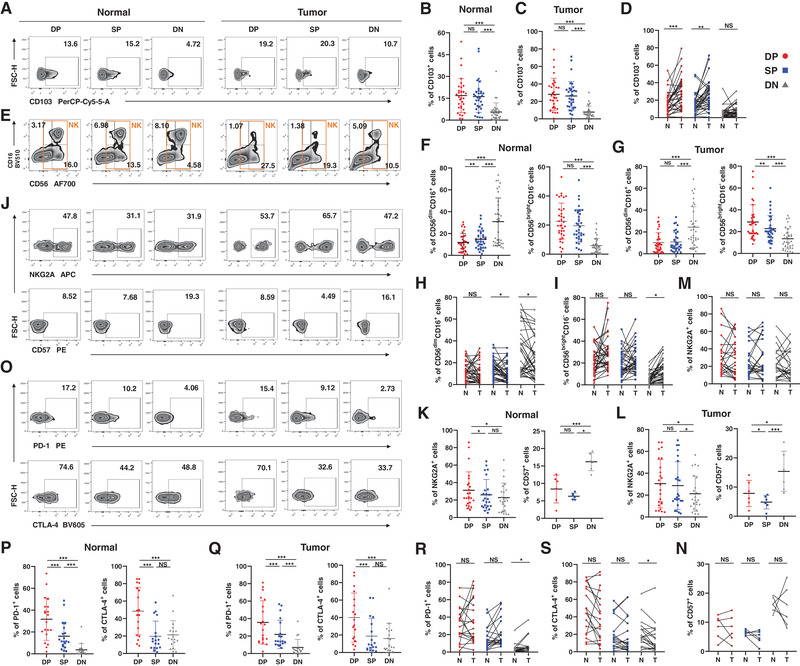
Figure 2.

The phenotype of the trNK cells in NSCLC. (A−D) The percentages of CD103+ cells in DP, SP, and DN NK cells from the normal (B) and tumor tissues (C). The comparisons of the percentages of CD103+ cells in DP, SP, and DN NK cells between the normal (N) and tumor (T) tissues (D). Data are shown as the representative flow analysis (A), mean ± SEM (B−C), and line chart (D). (E−I) The percentages of CD56dimCD16+ and CD56brightCD16− cells in DP, SP, and DN NK cells from the normal (F) and tumor tissues (G). The comparisons of the percentages of CD56dimCD16+ (H) and CD56brightCD16− cells (I) in DP, SP, and DN NK cells between the normal (N) and tumor (T) tissues. Data are shown as the representative flow analysis (E), mean ± SEM (F−G), and line chart (H−I). (J−N) The percentages of NKG2A+ and CD57+ cells in DP, SP, and DN NK cells from the normal (K) and tumor tissues (L). The comparisons of the percentages of NKG2A+ (M) and CD57+ cells (N) in DP, SP, and DN NK cells between the normal (N) and tumor (T) tissues. Data are shown as the representative flow analysis (J), mean ± SEM (K−L), and line chart (M−N). (O−S) The percentages of PD‐1+ and CTLA‐4+ cells in DP, SP, and DN NK cells from the normal (P) and tumor tissues (Q). The comparisons of the percentages of PD‐1+ (R) and CTLA‐4+ cells (S) in DP, SP, and DN NK cells between the normal (N) and tumor (T) tissues. Data are shown as the representative flow analysis (O), mean ± SEM (P−Q), and line chart (R−S). Data were obtained from the normal and paired tumor tissues resected from 35 of 52 operative NSCLC patients, pooled from three independent experiments. 33 of 52 samples were stained by CD103 (A−D); 35 of 52 samples were stained by CD56 and CD16 (E−I); 24 of 52 samples were stained by NKG2A (J−N); six of 52 samples were stained by CD57 (J−N); 20 of 52 samples were stained by PD‐1 (J−N); 18 of 52 samples were stained by CTLA‐4 (O−S). Symbols represent one individual sample. *p < 0.05, **p < 0.01, ***p < 0.001 (two‐tailed t‐test and Wilcoxon signed rank test in B−C, F−G, K−L, P−Q; two‐tailed paired t‐test and Wilcoxon matched‐pairs signed rank test in D, H−I, M−N, R−S).
