
FIGURE 1.
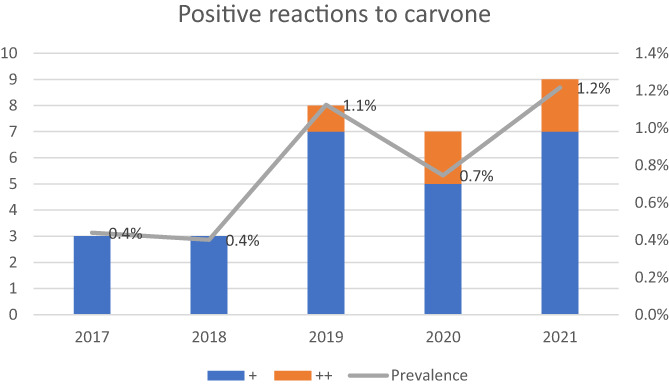
Trend of positive reactions to carvone. The colour of the bars corresponds to the strength of positive reactions to carvone.
Official websites use .gov
A
.gov website belongs to an official
government organization in the United States.
Secure .gov websites use HTTPS
A lock (
) or https:// means you've safely
connected to the .gov website. Share sensitive
information only on official, secure websites.
Trend of positive reactions to carvone. The colour of the bars corresponds to the strength of positive reactions to carvone.