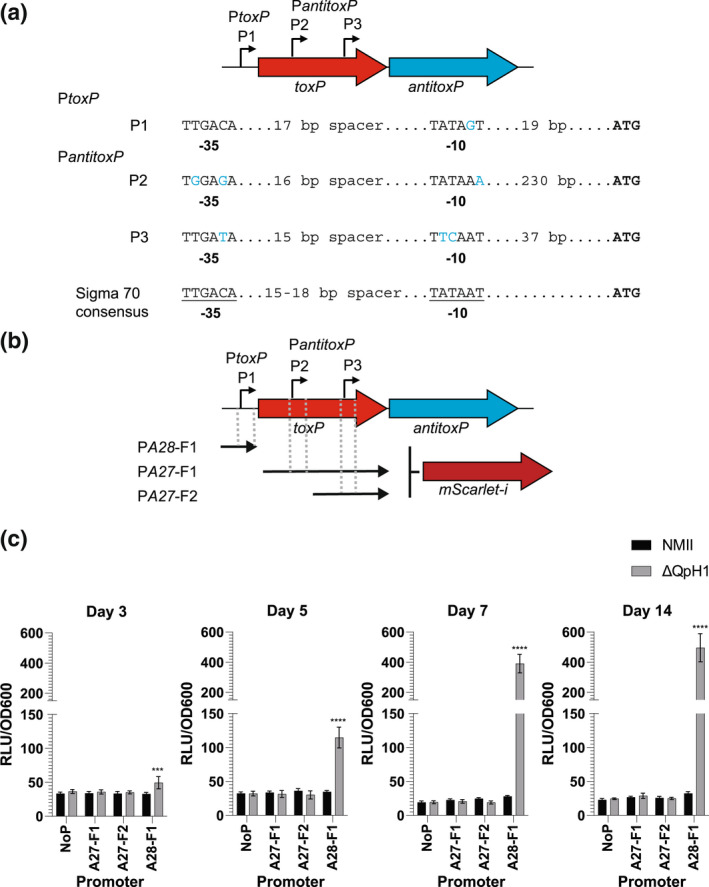
FIGURE 12.

Identification of potential antitoxP promoters within the toxP coding sequence. (a) Schematic of the toxP/antitoxP operon and location of toxP and antitoxP promoters. The sequence of each predicted promoter (−35 and −10 regions) was compared with the consensus sigma 70 promoters, and deviations to this sequence are depicted in blue. (b) The DNA fragments used to create transcriptional fusions to mScarlet‐i and their location in relation to antitoxP and toxP are depicted. (c) The activity of the transcriptional fusions in NMII and ΔQpH1 strains. The axenic medium was inoculated with Coxiella burnetii and incubated for 3, 5, 7, or 14 days then fluorescence was measured. Absorbance at OD600 was used as a proxy for C. burnetii growth and used to normalize bacteria fluorescence. Results are expressed as the means of results from two biological replicates from four independent experiments. Error bars indicate the standard deviations from the means, and asterisks indicate a statistically significant difference (two‐way ANOVA, ***p < .001, ****p < .0001)
