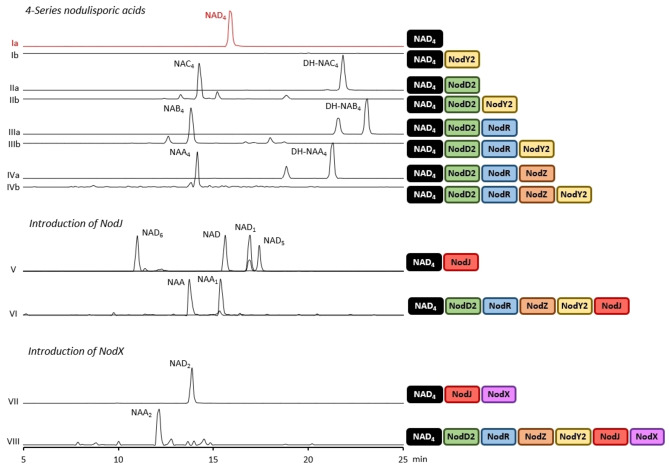
Figure 3.
LC‐MS analysis of transformants producing nodulisporic acids leading to the assignment of all clustered genes except nodY1 (genetic information for transformants is listed in the Supporting Information, Table S1). Traces are combined EICs of key fragments associated with each metabolite from HR‐ESI‐MS2 analysis (Supp. Info., Table S3). Note that the appearance of two peaks in traces IIIa, IIIb and IVa was attributed to the presence of 2′‐epimers (Supp. Info., Pg 79), and the smaller peak under NAD1 in trace V is the NAD6 EIC‐MS2 trace which also captures NAD1 due to the close parent mass and identical fragments (Supp. Info. Table S3).

