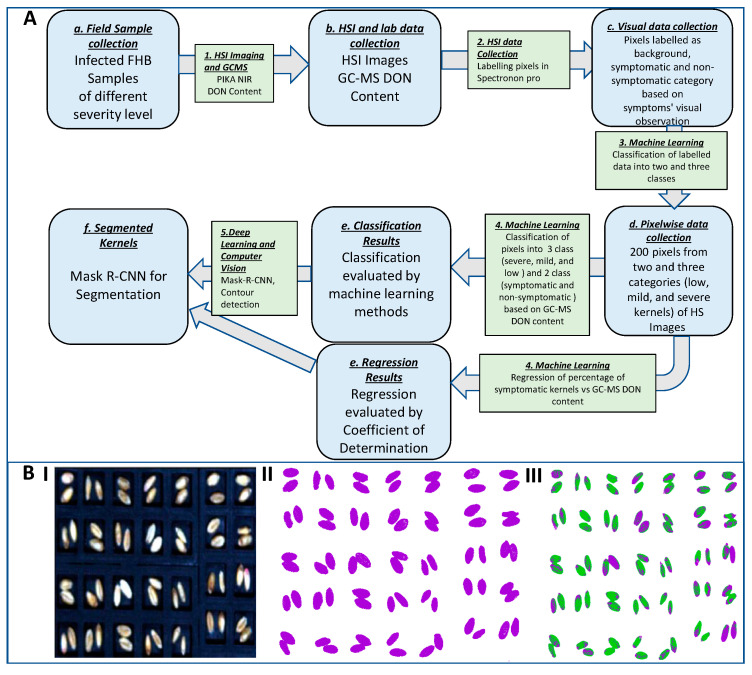
Figure 1.
(A) Data analysis pipeline for the wavelength selection to classify wheat kernels as symptomatic and non-symptomatic for Fusarium graminearum. (B) (I) RGB representation of HSI. (II) Classification of HSI into foreground (purple) and background (white) pixels. (III) Classification of HSI into symptomatic (purple), non-symptomatic (green), and background (white) pixels.

