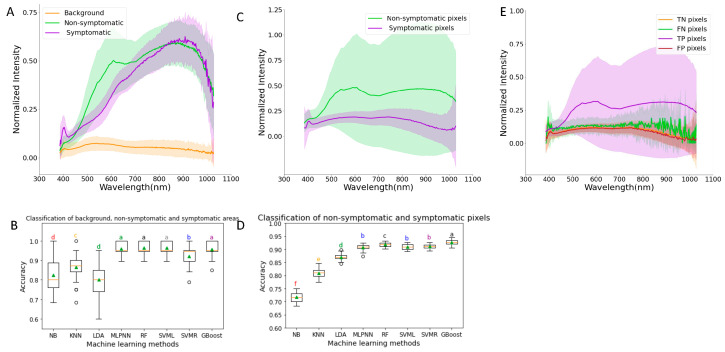
Figure 3.
(A) Spectral profile of background, non-symptomatic areas, and symptomatic areas of wheat kernel hyperspectral images. (B) Comparison of the performance of eight machine learning methods to classify data points into background, non-symptomatic area, and symptomatic area classes. (C) Spectral profiles of low and severe pixels. (D) Comparison of the performance of eight machine learning methods to classify pixel data points into low and severe classes. (E) Spectral profiles of true negative (TN), false negative (FN), true positive (TP), and false positive (FP) pixels. NB = Gaussian Naïve Bayes; KNN = K-nearest neighbors; LDA = linear discriminant analysis; MLPNN = multi-layer perceptron neural network; RF = random forests; SVML = support vector machine with linear kernel; SVMR = support vector machine with radial basis function kernel; G-Boost = gradient boosting. All data in (A,C,E) are normalized with a maximum value of 1.0. Letters a–f in (B,D) indicate statistical test results with same letter representing that the difference is not statistically significant.

