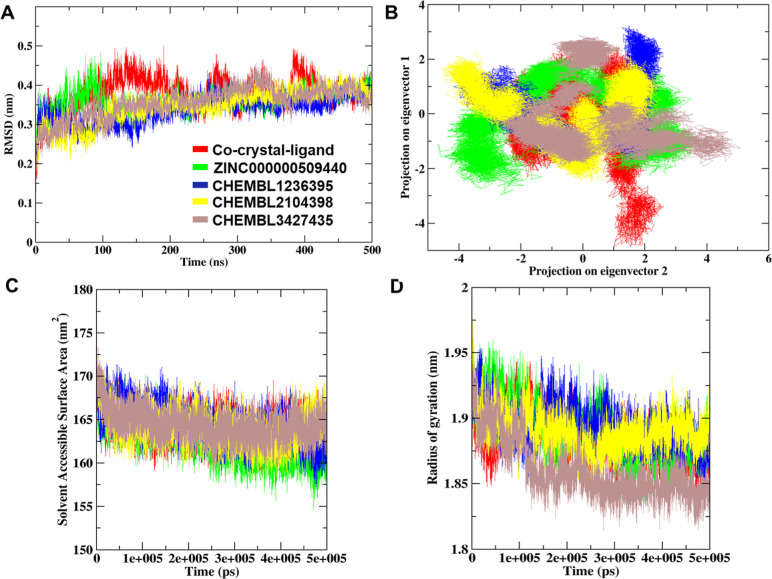
Figure 3.
MD simulation-allied parameters of the four drug complexes and reference molecule (ADP)-docked complex. (A) RMS deviation graph plotted against the cocrystal ligand, ZINC000000509440, ChEMBL1236395, ChEMBL2104398, and ChEMBL3427435. (B) The dynamic energy fluctuation graph plotted between eigenvector 1 and eigenvector 2 shows the conformational space of Cα-atoms for all five docked complexes. (C) SASA analysis plot of five TTBK2-docked complexes. (D) Comparative Rg plot of five docked complexes during 500 ns MD simulations.

