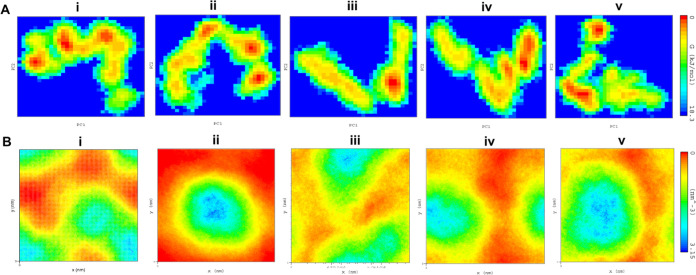
Figure 6.
FEL and density distribution analysis. (A) Free energy wells revealing the folding behavior, the direction of motions, and magnitude of dynamics of the docked complexes and (B) density distribution of docked complexes obtained in the MD trajectories during simulation timeframes: (i) co-crystal ligand, (ii) ZINC000000509440, (iii) ChEMBL1236395, (iv) ChEMBL2104398, and (v) ChEMBL3427435.

