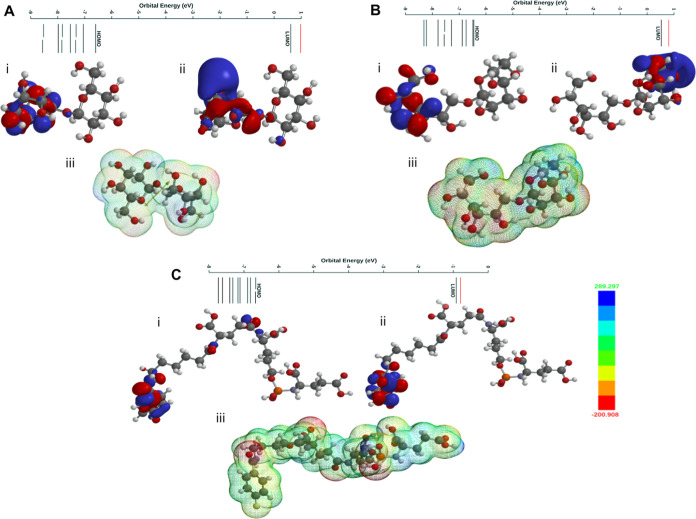
Figure 7.
(A) HOMO/LUMO orbitals and the energy potential map of ChEMBL1236395. (B) HOMO/LUMO orbitals and the energy potential map of ChEMBL2104398. (C) HOMO/LUMO orbitals and the energy potential map of ChEMBL3427435. The color of the potential is shown between −200 (red) and +289 kJ/mol (blue). The ESP surface area of the mesh model. The DFT calculations were performed using the Spartan’20 package with B3LYP/6-31G* in the gas phase.

