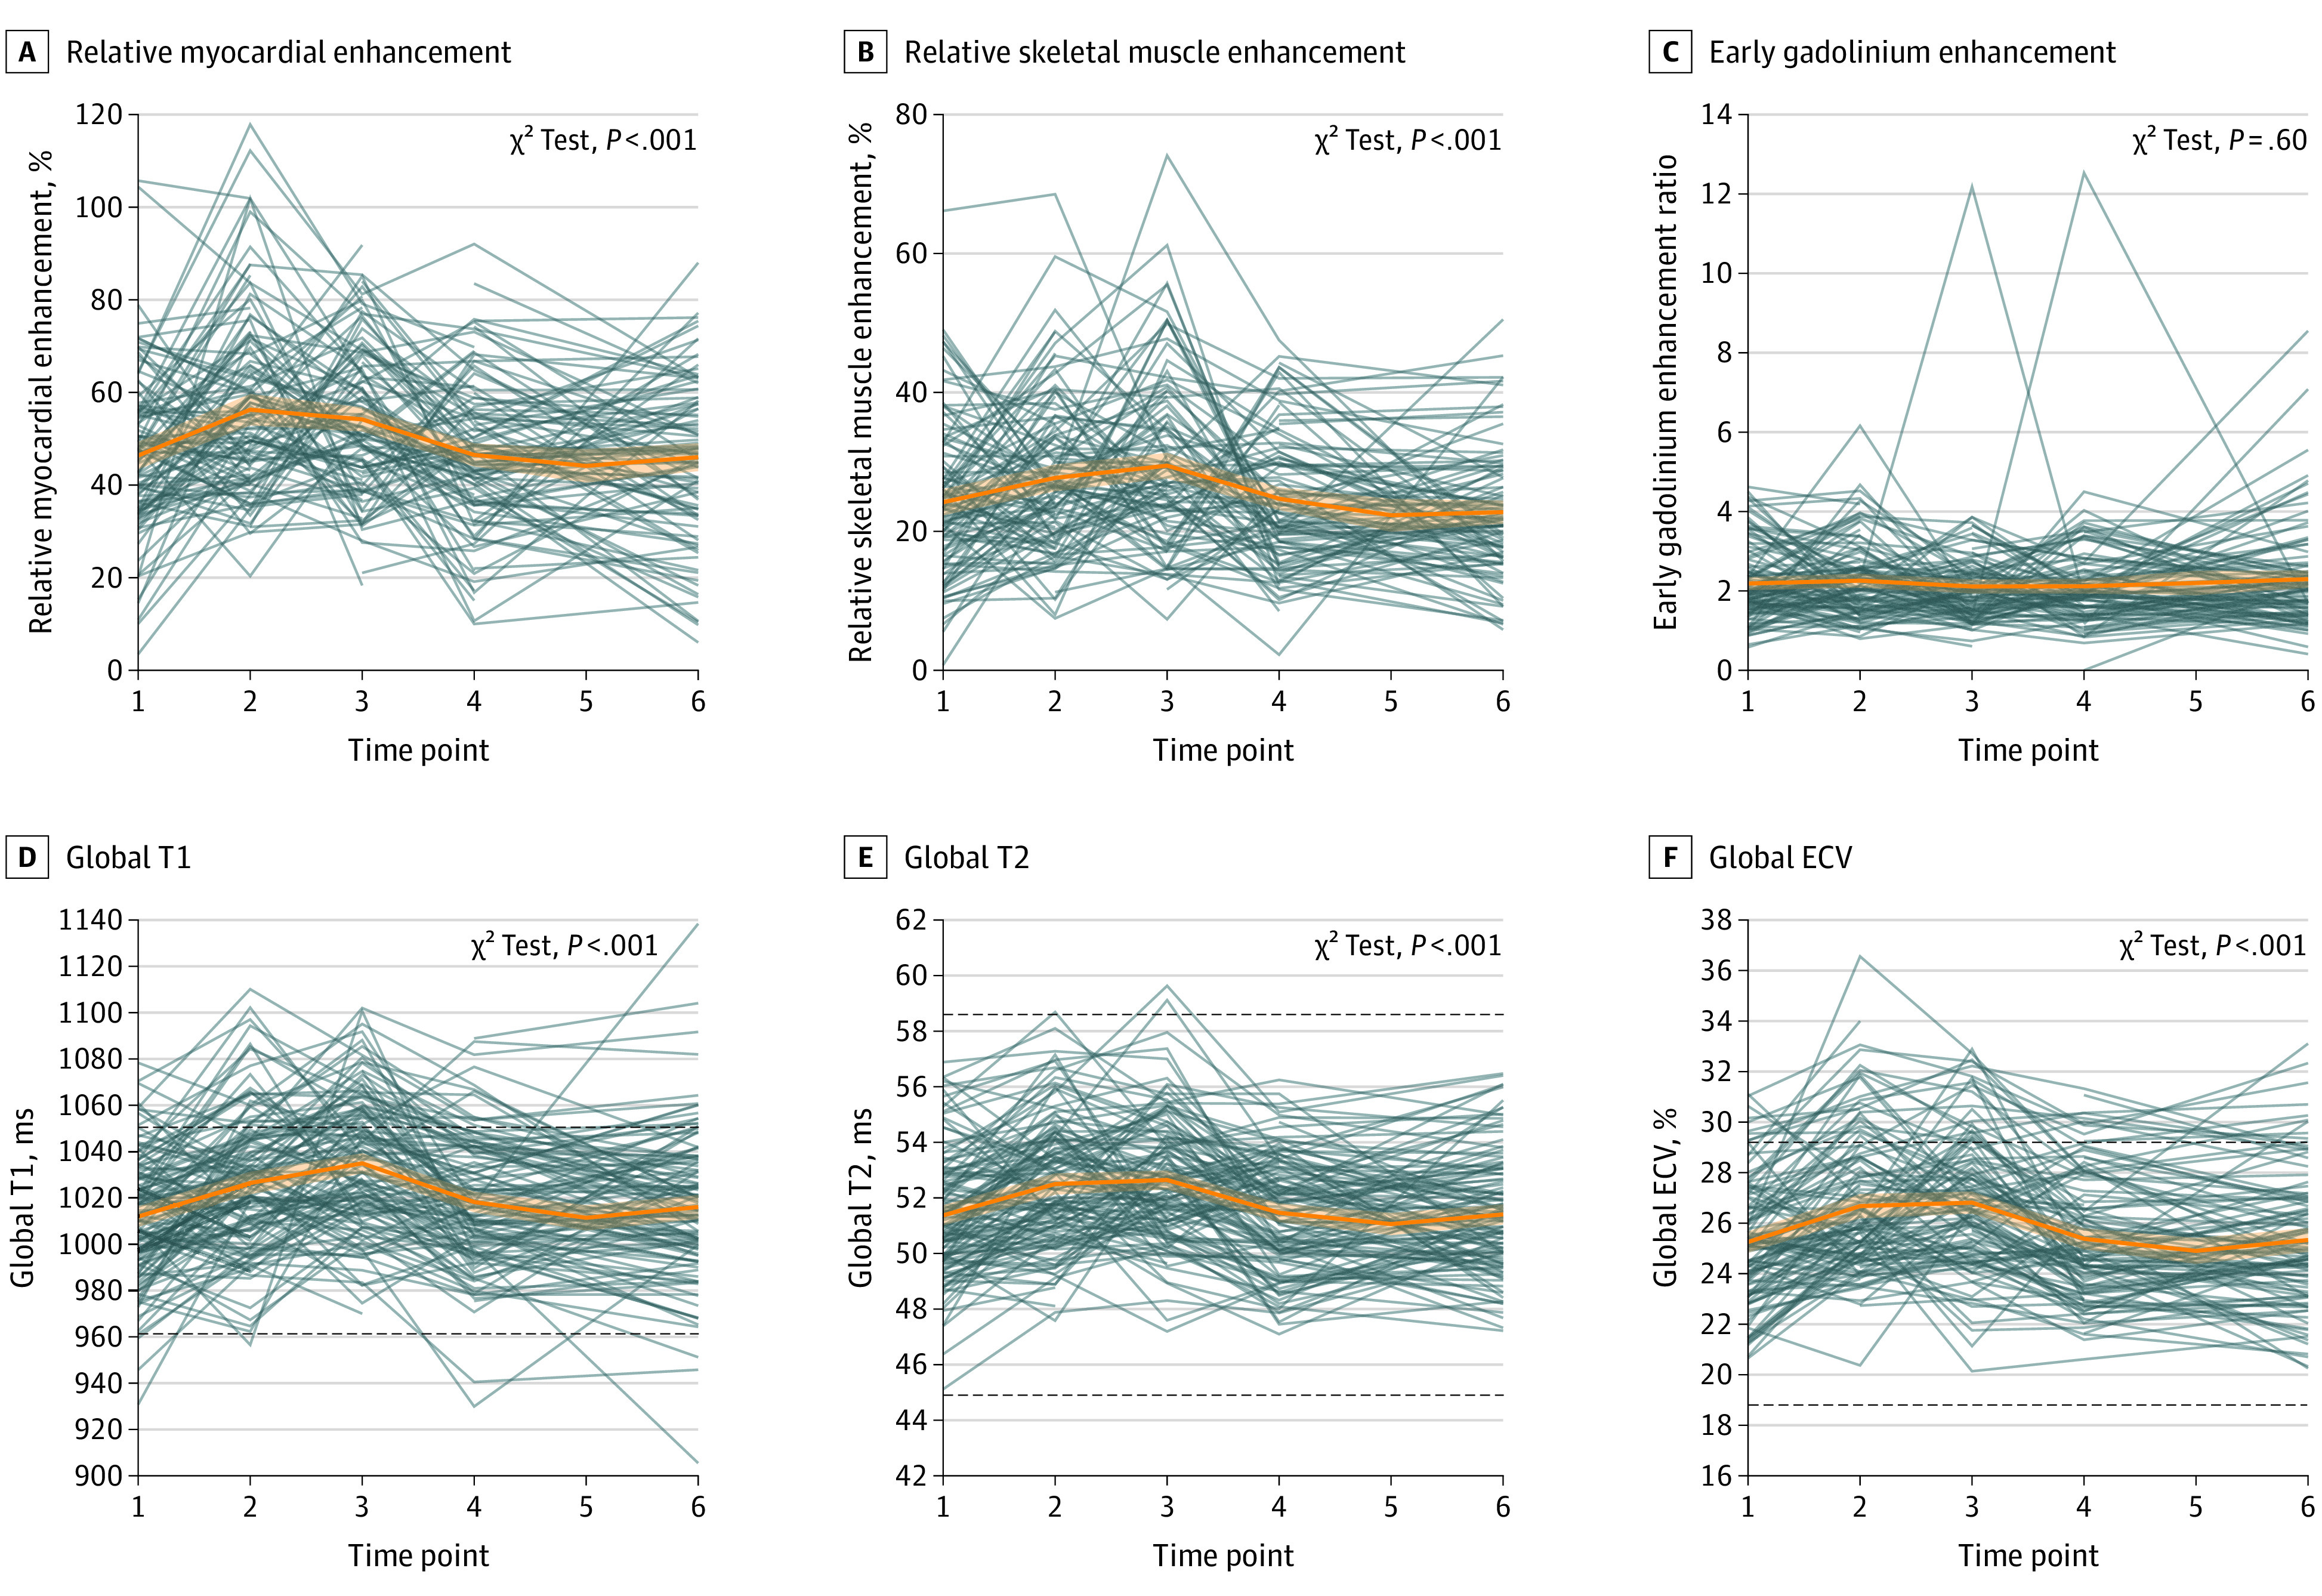
Figure 1. Cardiovascular Magnetic Resonance (CMR) Tissue Biomarkers at Each Study Visit.

Individual patient trajectories and overall trajectories (orange line) with corresponding 95% CI (orange shading) are shown for relative myocardial enhancement (A), relative skeletal enhancement (B), early gadolinium enhancement (C), global T1 (D), global T2 (E), and global extracellular volume fraction (ECV) (F). The P values assess if the estimated trajectory is different from a horizontal line (ie, no changes from baseline). Relative myocardial and skeletal muscle enhancement, T1, T2, and ECV all peaked after anthracycline (before trastuzumab) therapy or 3 months into trastuzumab therapy and returned to baseline by end of trastuzumab therapy (eFigures 10 and 11 and eTable 6 in Supplement 1 for grouping based on cancer therapy–related cardiac dysfunction status). Time points on the x-axis are as follows: 1, before anthracycline therapy; 2, after anthracycline but before trastuzumab therapy; 3, three months after trastuzumab initiation; 4, six months after trastuzumab initiation; and 6, after trastuzumab completion. No CMR data was collected at time point 5. Normal ranges for same CMR sequences and scanner from our prior publication15 is provided as dashed lines for T1, T2, and ECV.
