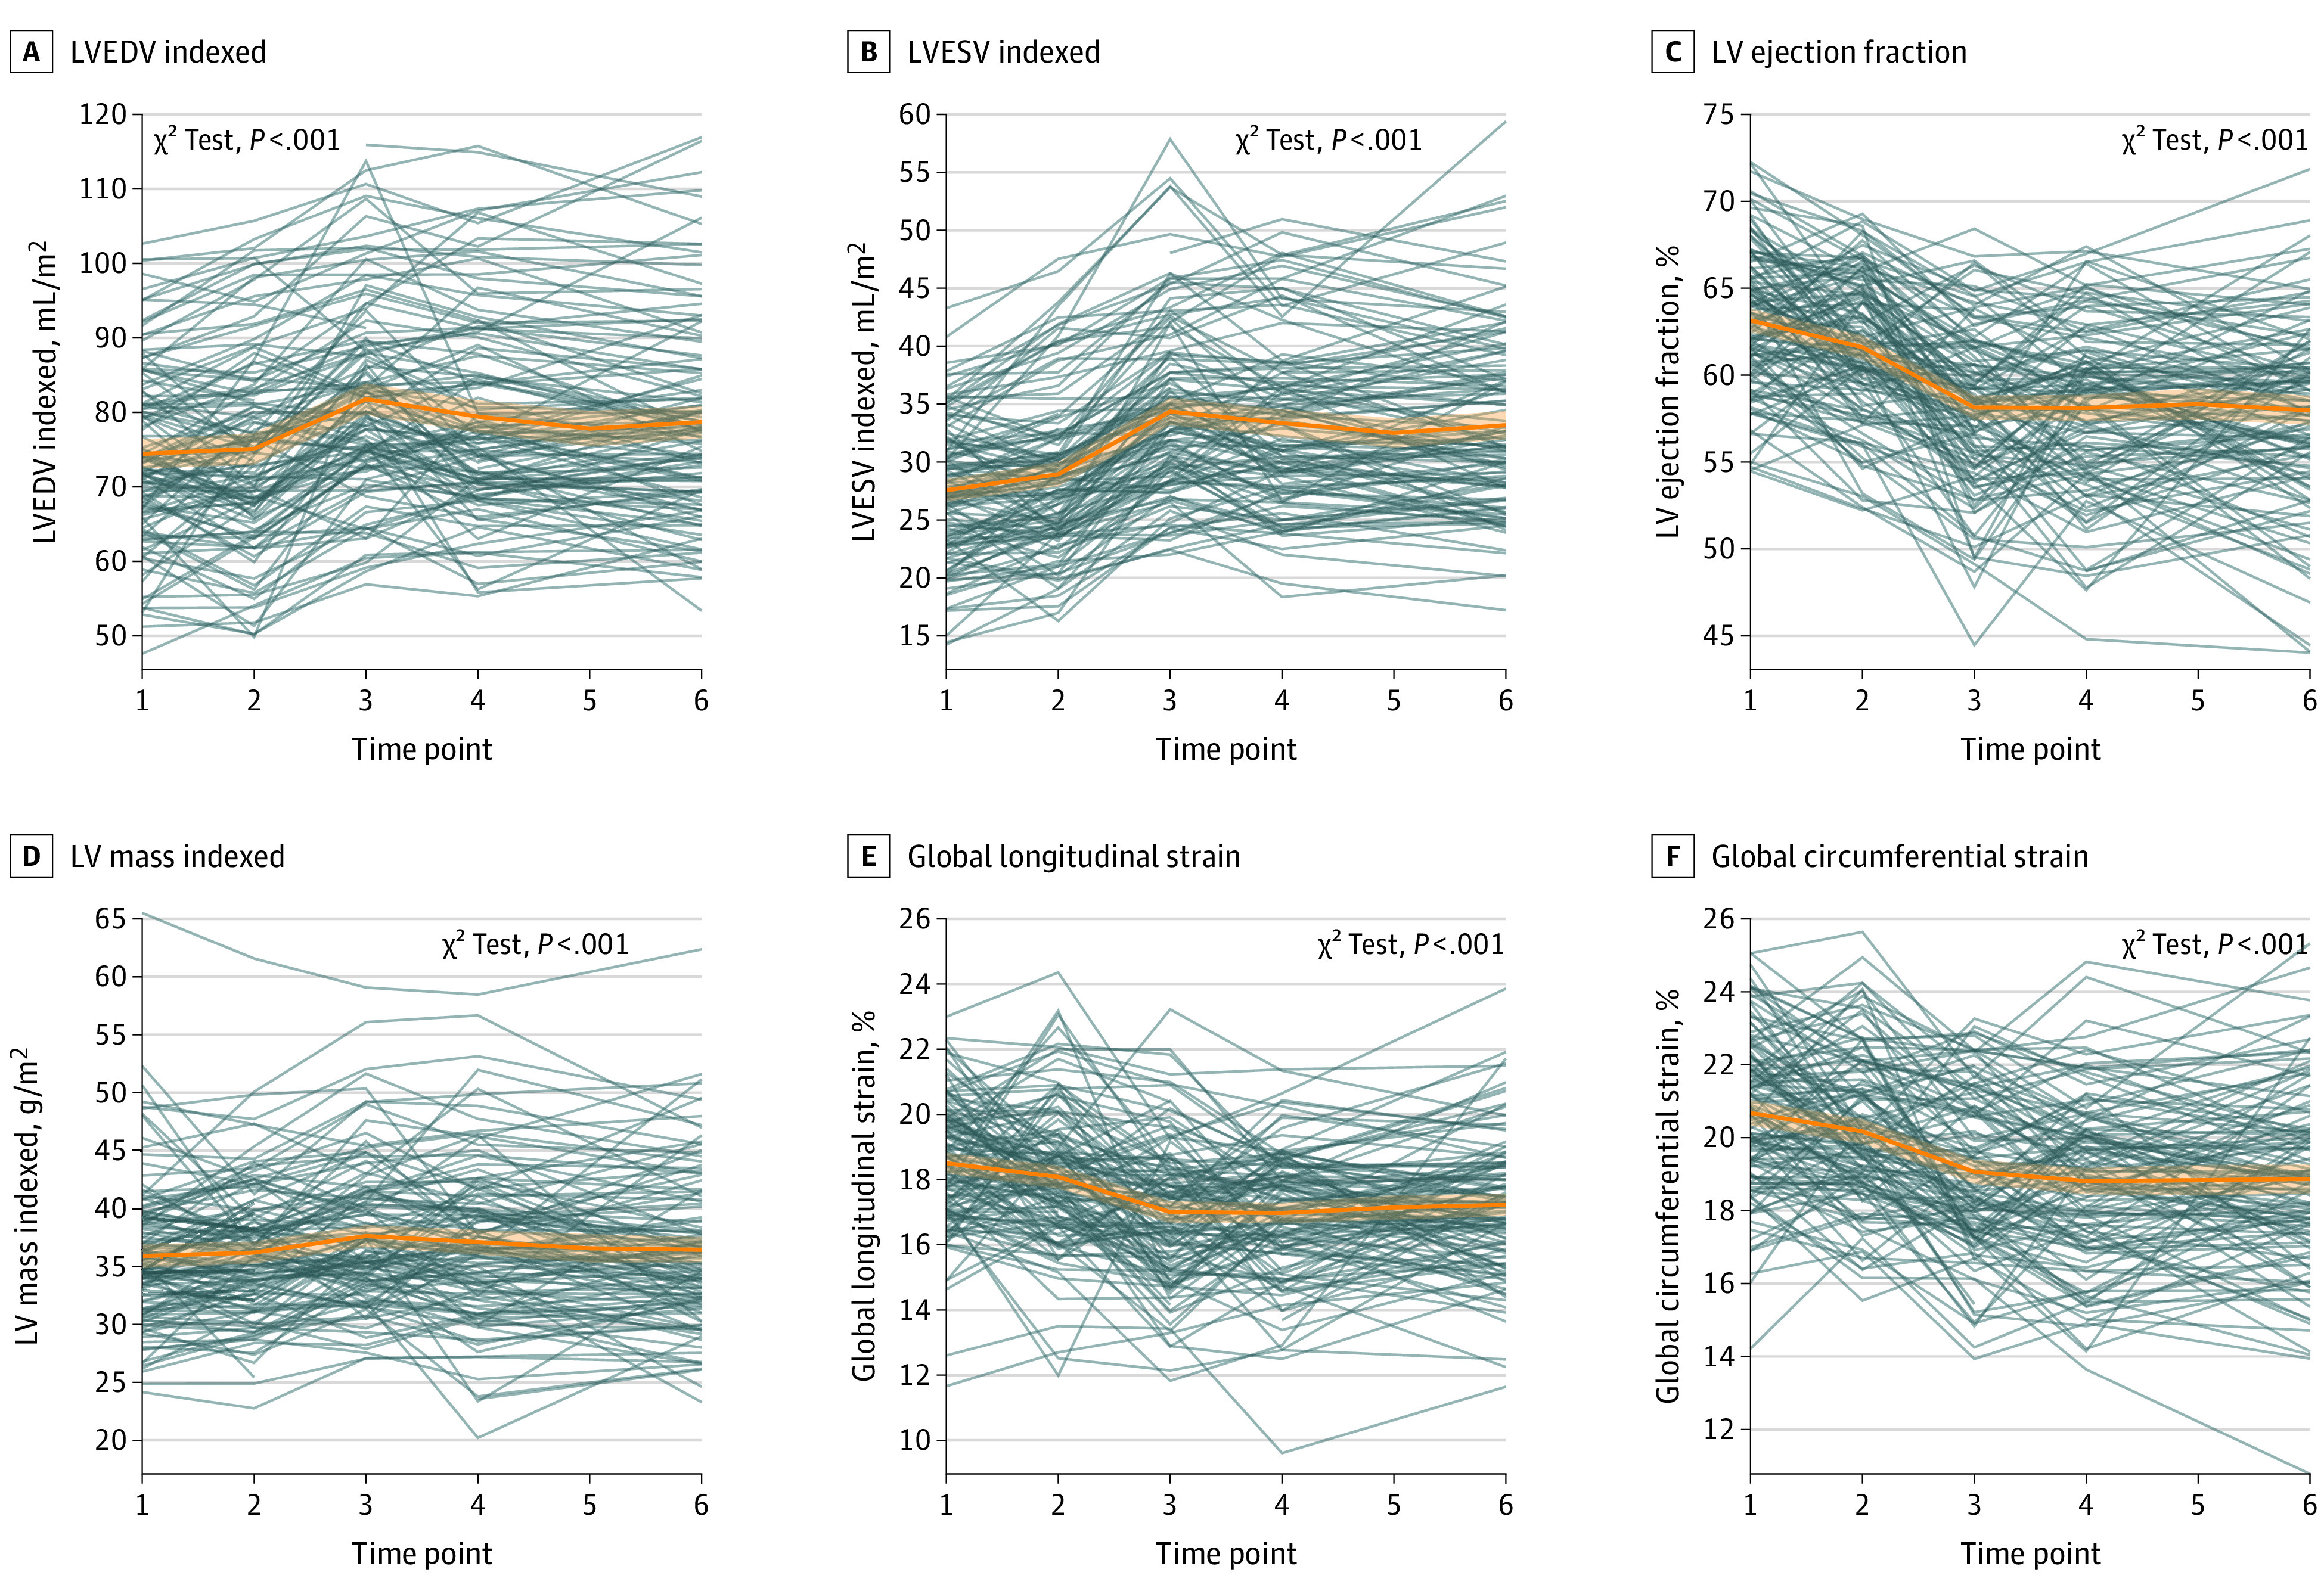
Figure 2. Left Ventricular (LV) Volumes, Mass, and Function at Each Visit.

Individual patient trajectories and overall trajectories (orange line) with corresponding 95% CI (orange shading) are shown for LV end-diastolic volume (EDV) (A), LV end-systolic volume (ESV) (B), LV ejection fraction (C), LV mass indexed (D), global longitudinal strain (E), and global circumferential strain (F). On average, ventricular volumes and mass reached their largest, while LVEF and both strain measures reached their minimum first at 3 months into trastuzumab therapy with incomplete or no recovery by end of follow-up. The P values assess if the estimated trajectory is different from a horizontal line (ie, no changes from baseline). Figure 1 contains the definition of the time points. eFigures 8 and 9 in Supplement 1 display the same measures grouped based on cancer therapy–related cardiac dysfunction status.
