
Figure 3. Regression-Adjusted Nonlinear Concurrent Associations Between Cardiovascular Magnetic Resonance (CMR) Tissue Biomarkers and Left Ventricular (LV) Volumes and Ejection Fraction.
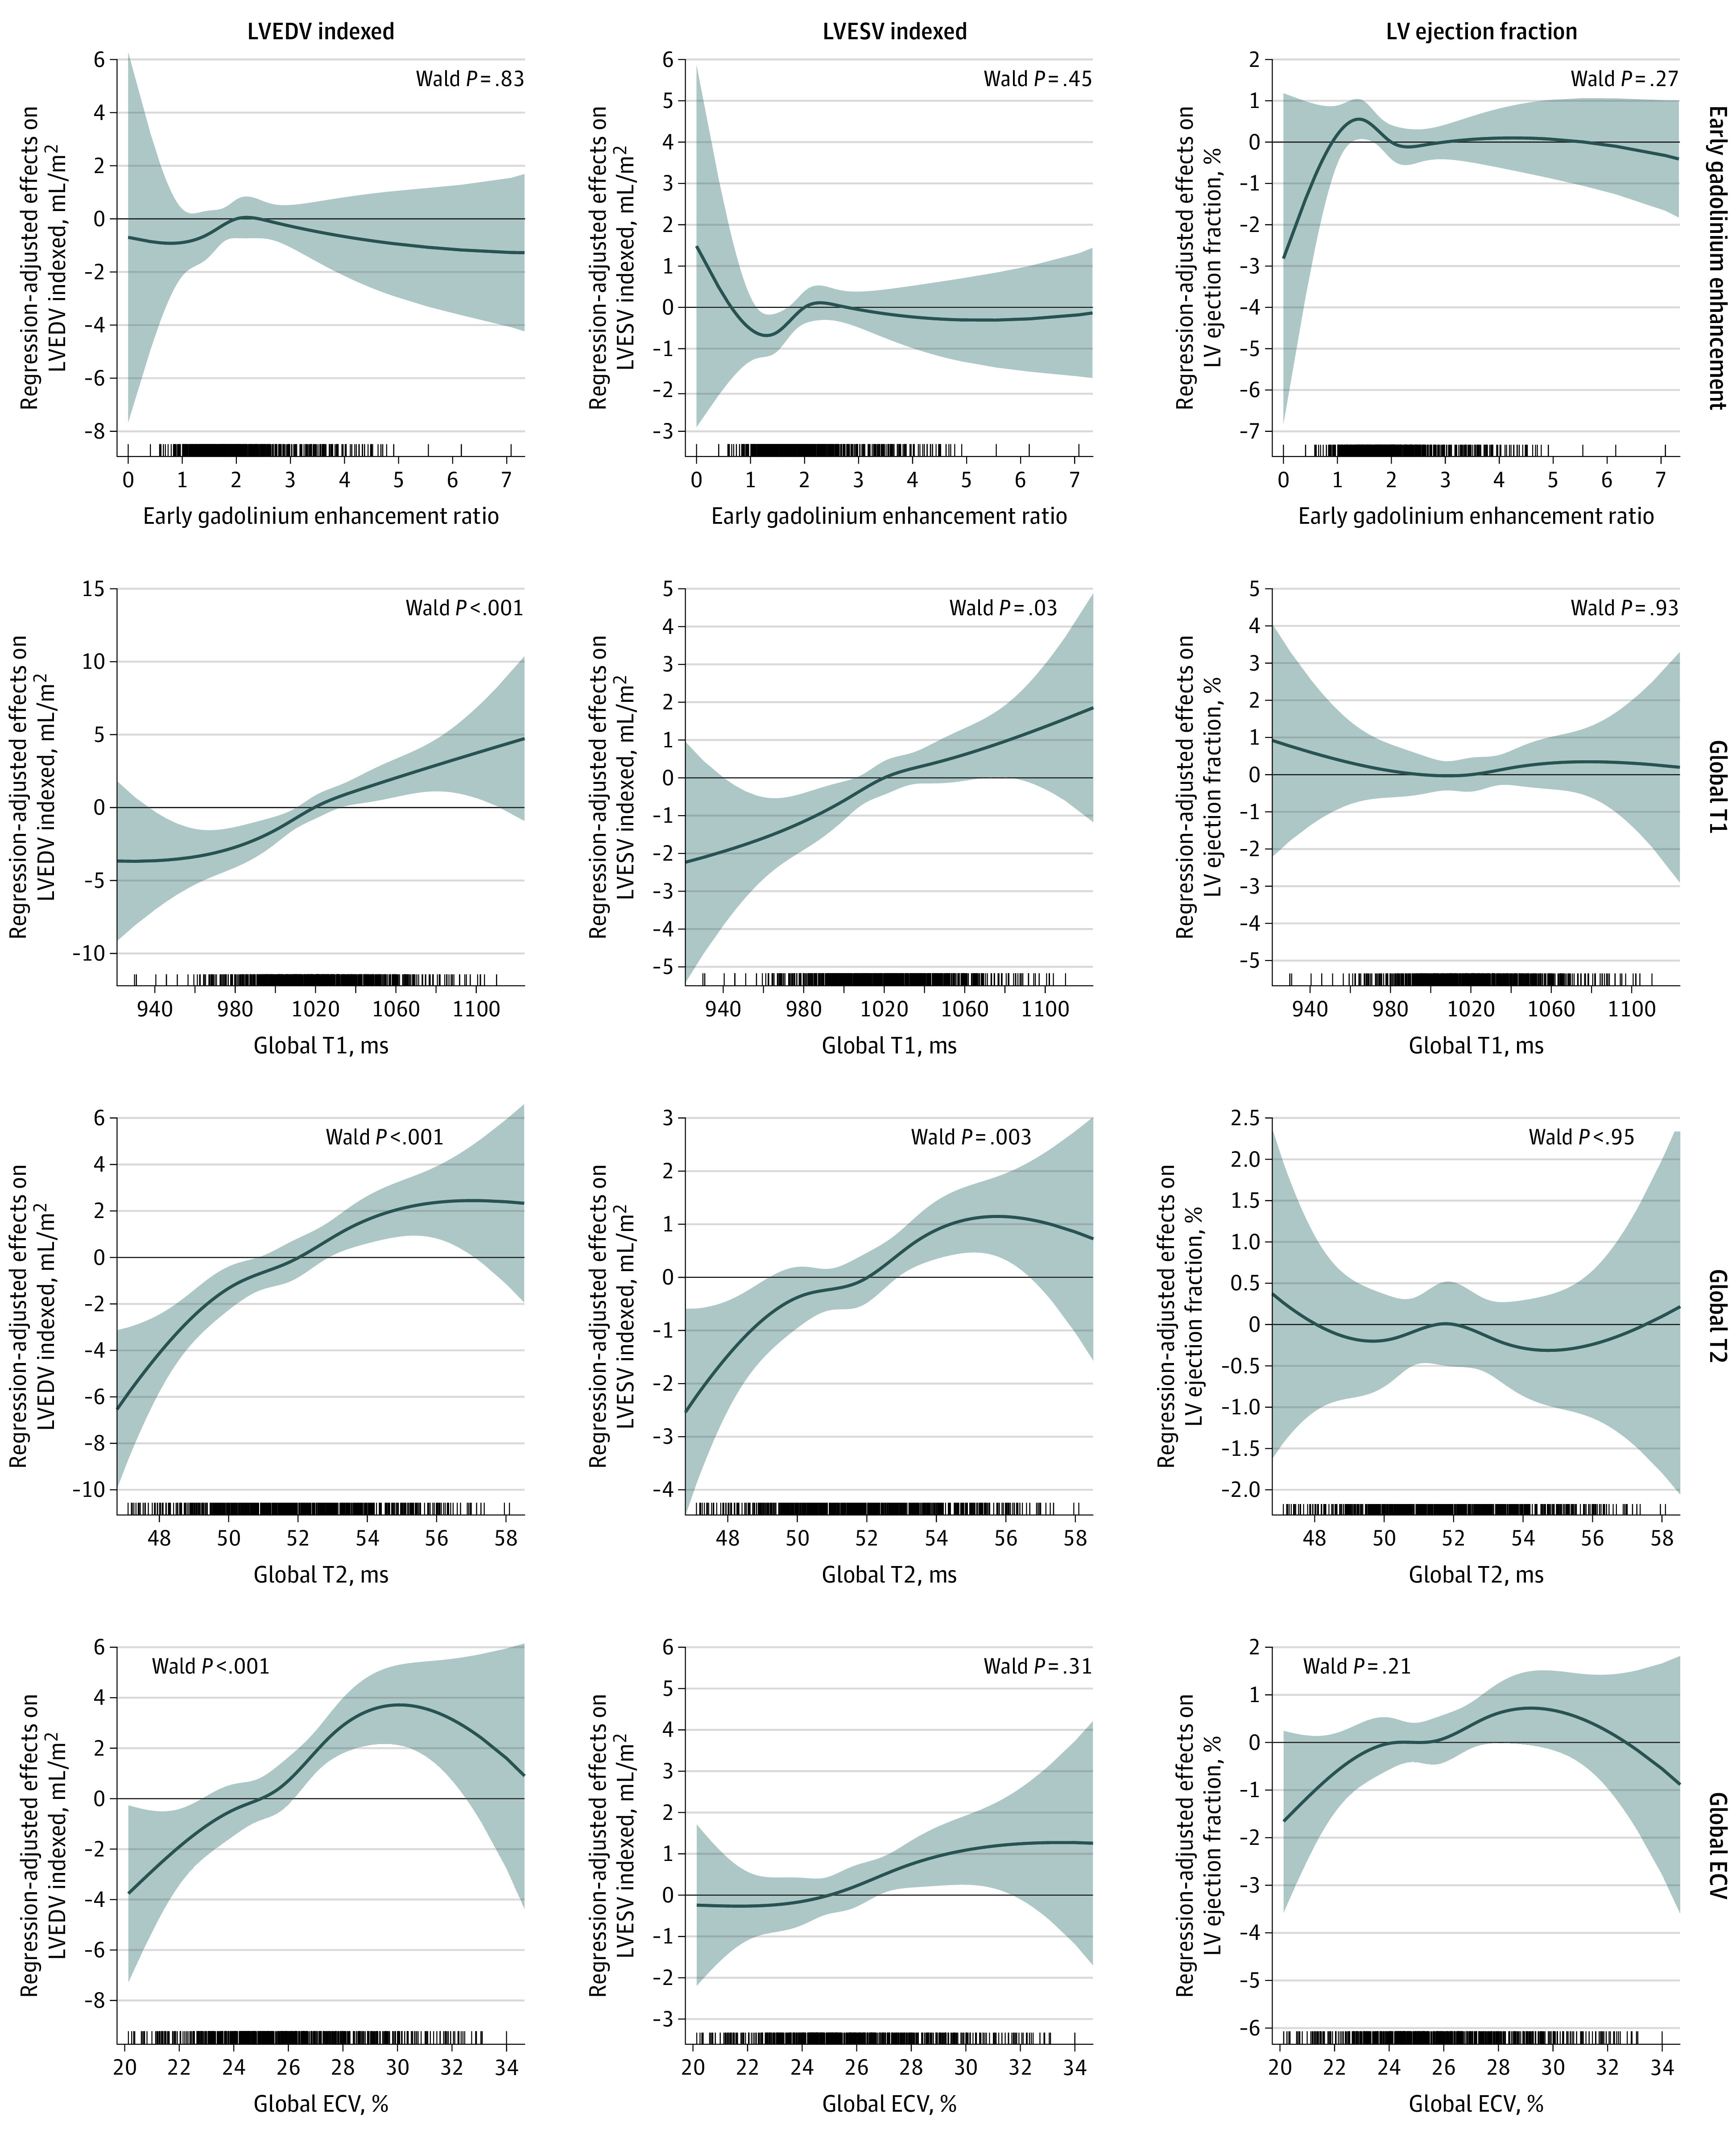
The graphs show the expected changes in outcome variables (y-axis) associated with changes in CMR tissue biomarkers (x-axis). For example, a change in T1 from 1000 to 1050 milliseconds was associated with an increase in LV end-diastolic volume (EDV) index of 3.12 (95% CI, 1.99-4.25) mL/m2 and LV end-systolic volume (ESV) index of 1.07 (95% CI, 0.47-1.67) mL/m2. The tick marks on the x-axis reflect individual observed measurements. The shaded region represents the 95% CI of the estimated association. P values <.05 suggest statistically significant associations. ECV indicates extracellular volume fraction.