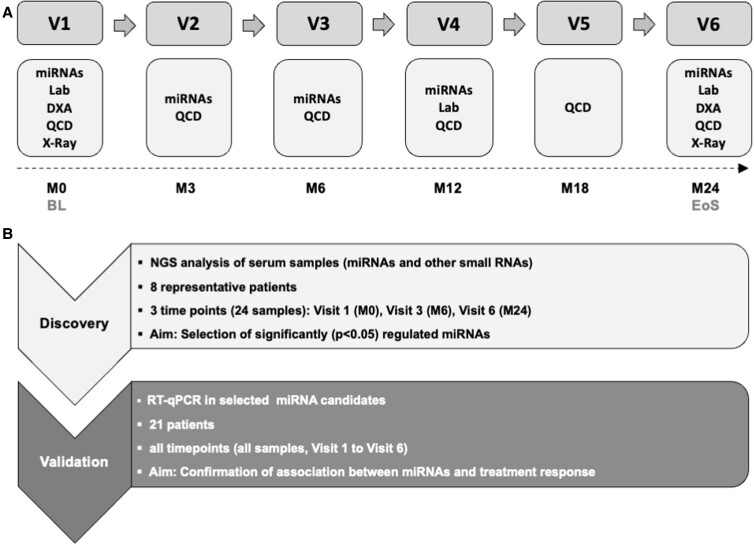
Figure 1.
Study design. Study Flow Chart. A, Postmenopausal women with osteoporosis were treated with denosumab for 2 years (n = 21). Abbreviations: BL, baseline; DXA, dual x-ray absorptiometry; EoS: end of study; Lab, serum markers of bone metabolism; M, month; miRNA: microRNA analysis; QCD: Questionnaire on demographic and clinical data; X-Ray: x-ray of thoracic and lumbar spine. Experimental Design B, MiRNA analysis was divided into 2 phases: a discovery phase and subsequent validation phase. In the discovery phase, next-generation sequencing (NGS) was performed to screen and select significantly regulated miRNAs at 3 time points in a subset of 8 (selected from 21) subjects. The validation phase utilized reverse transcription quantitative polymerase chain reaction (RT-qPCR) to quantify the selected miRNAs in all subjects and time points (except Visit 5), and perform correlation analysis to confirm the association between miRNAs and treatment response. In the validation phase, 8 patients from the discovery phase plus 13 additional patients were included.

