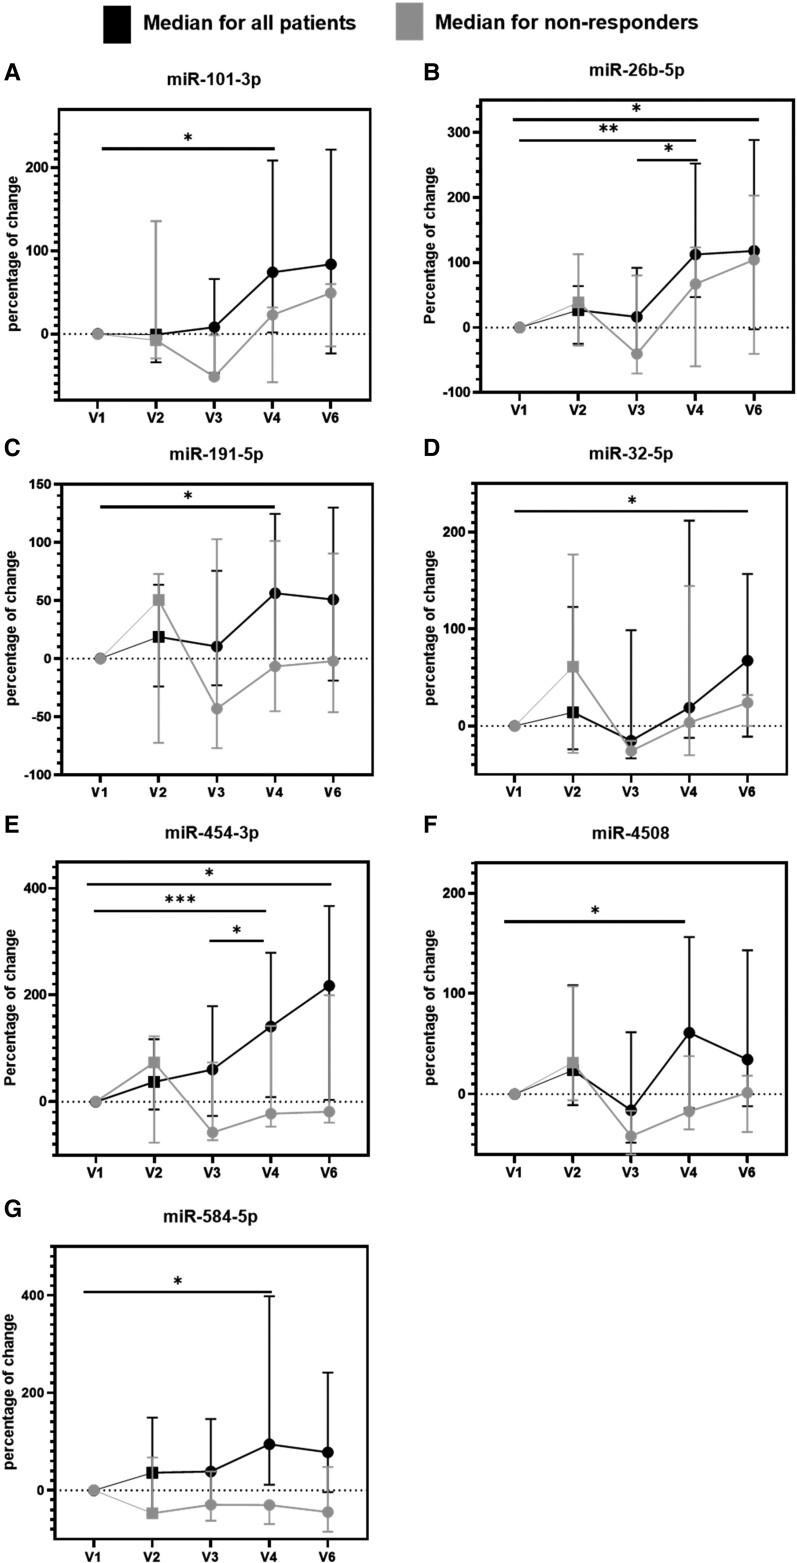
Figure 3.
Reverse transcription quantitative polymerase chain reaction (RT-qPCR) confirmation of miRNA serum levels in 21 subjects and 5 time points. Line plots for the 7 miRs that were confirmed to change over time are shown as the median percentage of change in miRNA levels together with the interquartile range (n = 18). Data for patients with a decrease in spine BMD after 2 years (n = 3) is highlighted in gray. One-way ANOVA with RM using the normalized Cq-values: *adjusted P values between 0.01 and 0.05, **adjusted P values between 0.01 and 0.001, ***adjusted P values between 0.001 and 0.0001.

