FIGURE 5.

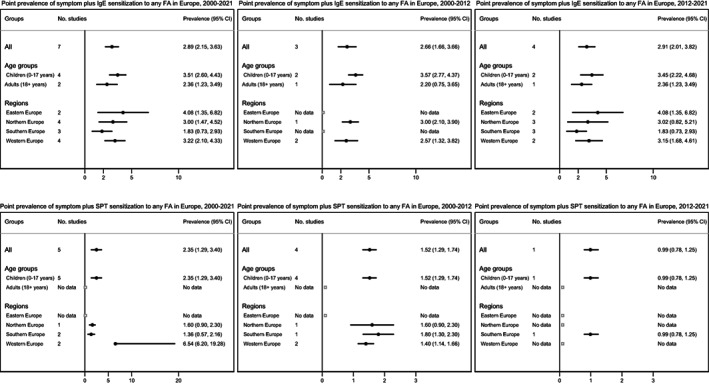
Pooled estimates for symptoms plus sIgE (top) or SPT (bottom) sensitization to any food allergy in Europe between 2000 and 2021, 2000 and 2012, and 2012 and 2021.

Pooled estimates for symptoms plus sIgE (top) or SPT (bottom) sensitization to any food allergy in Europe between 2000 and 2021, 2000 and 2012, and 2012 and 2021.